
// Creative Agency
Small Business Website Analytics: What to Track in 2026

Small business website analytics means collecting data on how people find and use your site, then using it to decide what to fix, what to publish and where to spend marketing money. The free route most owners take is Google Analytics 4 (GA4). Set it up once, pick a handful of metrics tied to real business goals, mark your lead and sales actions as key events, and review the numbers on a schedule. This guide shows how, in plain steps.
TL;DR
- Website analytics shows where visitors come from, what they view, and whether they take an action that matters to you, such as a purchase or a form submission.
- Start with four groups of metrics: traffic, engagement, conversions and performance. Ignore the rest until those are in place.
- In GA4, track leads and sales by sending the right events and marking them as key events.
- Traffic alone is a poor scorecard. Tie every metric to a goal, make one focused change, then measure again.
- Review on a fixed rhythm and handle customer data with care.
Table of Contents
- What website analytics actually tells you
- The metrics worth your attention
- Set up Google Analytics 4 in a sensible order
- How to track website conversions
- Use the data to improve pages and campaigns
- How often to review your analytics
- Handle customer data responsibly
- Our perspective: analytics should end in a decision
- Common setup mistakes to avoid
- Get help setting up tracking that you own
- FAQ
- Sources
What website analytics actually tells you
The U.S. Chamber of Commerce describes website analytics as collecting and analyzing data about how people interact with your site: where they come from, what they view, how long they stay, what they click and whether they buy or complete another conversion. The payoff is a clearer view of what to improve in your marketing, content, customer experience and site performance.
The federal government’s digital team at Digital.gov puts the purpose a little differently. Analytics helps you see whether people can complete tasks quickly and easily, and it supports design decisions based on evidence instead of opinion.
In practice, that means analytics answers questions you probably already have:
- Is the money I spend on ads, email or social media sending anyone to the site?
- Which pages do people read, and which do they leave right away?
- Do visitors who reach the contact page actually send the form?
- Is the site slow on phones?
Without data, each of those is a guess. With it, each becomes a short report.
The metrics worth your attention
A default analytics account shows dozens of numbers. Most small teams need a short list. The Chamber guide groups core metrics into four buckets, and that structure is a good way to keep your dashboard sane.
| Group | What to watch | The question it answers |
|---|---|---|
| Traffic | Visitors, traffic sources | Where do people come from, and is it growing? |
| Engagement | Bounce rate, pages per session, time on site | Do visitors find the page useful? |
| Conversions | Conversion rate, form submissions, purchases, downloads | Do visitors do what we want? |
| Performance | Page-load speed | Is the site fast enough to keep people? |
The grouping comes from the U.S. Chamber’s analytics guide. Penn State Extension lists a similar set: visitor counts, unique visitors, bounce rate, session duration, location, device type, traffic source and e-commerce activity.
SCORE, the nonprofit small-business mentoring network, adds a few more for owners to monitor: pageviews, sessions, new visitors, pages per session, average time on page, goals and revenue. It also notes that behavior reports can show how individual pages perform, where visitors land and leave, how fast pages load, which terms people type into your internal search and how they move through the site.
How to read them without drowning
Pick one metric per group and write down what “good” looks like for your business. A local plumber might care most about form submissions and calls from mobile visitors. An online shop cares about purchases, add-to-cart actions and where checkout is abandoned. A consultant selling high-value work may only need a handful of qualified leads per month.
Two cautions help here:
- Bounce rate and time on site need context. A visitor who lands on your address page, reads it and leaves has done what they came for. Read engagement numbers next to the page’s purpose.
- Speed is a business metric. The Chamber guide says page-load time affects user experience and search visibility, and that slow performance can increase drop-off. If your mobile pages crawl, fix that before polishing anything else.
Set up Google Analytics 4 in a sensible order
Most small businesses searching for Google Analytics help want a path that does not require a developer or a week of reading. Google’s own beginner guide lays out the order: create a Google Analytics property, add a data stream and the Google Analytics code, learn the interface, browse reports, then set up conversions for the actions that matter to your business.
In plain terms:
- Create the property and a web data stream. The stream is the connection between your site and your account.
- Install the tag. On WordPress this usually means adding the tag through your theme, a tag manager or a plugin. Confirm it works by opening your site and checking the real-time report.
- Learn the two report layers. Google Analytics Help explains that GA4 collects website and app data into reports for monitoring traffic, investigating data and understanding users, available as overview reports and more detailed reports. Start with overviews, then go deeper only when a question demands it.
- Define your key actions before you click around. Which two or three actions would you celebrate? That list drives the next step.
The free version of GA4 covers the needs of most small sites, but the setup is where mistakes creep in: a tag installed twice, internal traffic counted as customers, or no conversions defined at all. If you would rather not troubleshoot that yourself, our GA4 conversion tracking setup guide walks through the full configuration.
How to track website conversions
A conversion is any action that moves a visitor toward becoming a customer. In GA4, you measure these with events.
Google’s list of recommended events gives you ready-made names for the common cases:
- purchase for completed orders
- generate_lead for form submissions or requests for information
- sign_up for registrations
- add_to_cart and begin_checkout to measure steps in a buying funnel
If you track leads through a longer sales process, the same page lists additional lead events such as qualify_lead, disqualify_lead, working_lead, close_convert_lead and close_unconvert_lead. They can reflect activity that happens offline, for example when a salesperson closes a deal after the web inquiry.
Turn an event into a key event
Google Analytics Help explains that any collected event can be marked as a key event when it represents an action important to your business. The resulting reports show how many users completed it and which channels led them there. Google also distinguishes key events in Analytics from conversions used for advertising measurement and bidding, and notes that an Analytics event can be used to create a Google Ads conversion.
A simple setup for a service business looks like this:
- Make sure your contact form fires generate_lead on a successful submission (the thank-you state, not the button click).
- Mark generate_lead as a key event.
- If phone calls matter, track taps on your phone number on mobile as a separate event.
- After a few weeks, open the acquisition reports and compare which channels produce leads, not just visits.
That last step is where analytics starts to pay for itself. A channel that sends 2,000 visitors and no leads is less valuable than one that sends 80 visitors and 10 inquiries.
Use the data to improve pages and campaigns
Collecting numbers is the easy half. The Chamber guide suggests a loop: define business goals, look for patterns such as high-engagement pages, drop-offs or channels driving conversions, make targeted changes (better content, simpler navigation, an adjusted marketing approach) and then measure whether engagement and conversions improve. The advice is to avoid fixing everything at once, which makes it impossible to tell what worked.
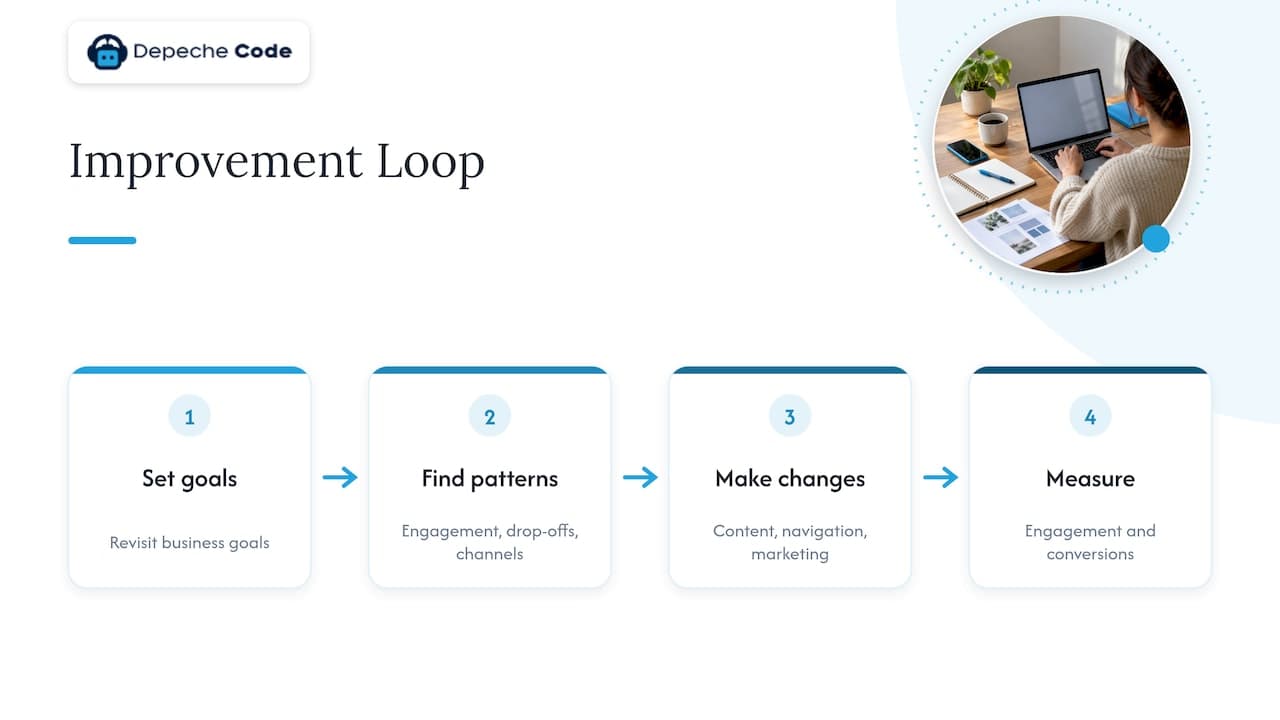
Penn State Extension makes the same point from a goal-first angle: revisit your business and marketing goals before looking at data, then identify what data tells you whether your content and its timing are doing the job.
A worked example
Imagine a home-services company whose reports show:
- Mobile visitors make up most of its traffic.
- The quote-request page gets plenty of views but few submissions.
- Mobile page-load speed is slow on that page.
The loop would go like this. Goal: more quote requests. Pattern: drop-off on the quote page, worst on phones. Change: compress images, shorten the form from nine fields to five and move the button higher. Measure: compare form submissions and mobile bounce rate over the next several weeks. If submissions rise, keep the change. If not, test the next hypothesis.
This example is illustrative, not a client result, but the logic applies to any site. Our articles on how user experience drives website conversions and how to increase website engagement cover the kinds of changes worth testing.
Do not stop at traffic
Digital.gov warns against focusing on traffic alone. The question is whether the site fulfills its purpose and whether customers can accomplish their tasks. A traffic spike from a viral post that never converts is nice for the ego and useless for payroll.
Australia’s business.gov.au offers one more habit worth borrowing: monitor your metrics over time, create more of the content your customers prefer, work on search visibility and use A/B tests to compare two versions of a webpage or email. The guide is Australian, but the practice is universal.
How often to review your analytics
The Chamber guide recommends checking results after you make changes, to see what worked, and continuing to refine over time. A practical rhythm for a small team:
- Weekly, 10 minutes: traffic sources, key events, anything that looks broken (a sudden drop to zero usually means a tag problem).
- Monthly, 45 minutes: compare against the prior month, review your top and bottom pages, decide on one or two changes.
- After every change: note the date, then check the affected page’s numbers a few weeks later.
- Quarterly: revisit your goals. If the business has shifted, your key events should shift too.
Keep a simple change log in a spreadsheet. Six months on, it explains why numbers moved.
Handle customer data responsibly
Analytics collects information about real people. The National Institute of Standards and Technology (NIST) stated in January 2023 that small businesses that use analytics, or rely on analytics service providers, should address privacy risk, because website activity, email interactions, chats, calls and surveys can all provide customer data.
Its suggested steps are concrete:
- Review the contracts of your service providers.
- Confirm customer information is used only for the intended analytics purposes.
- Require notice of privacy or security incidents.
- Consider privacy-enhancing technologies that help anonymize data.
If your site serves visitors in states or countries with privacy rules, ask a qualified attorney what consent notices and policy language you need. The right answer depends on where your customers live and what you collect.
Our perspective: analytics should end in a decision
We see the same pattern with many small businesses: a site goes live, an analytics tag gets pasted in, and nobody looks at it again. The data exists, but no one owns it.
Our view is that analytics belongs inside the website project, not after it. When we build or redesign a site, we think about what the business wants a visitor to do, how we will measure it, and how fast the pages need to load before a single report is opened. We use Google PageSpeed and SEO scores as everyday benchmarks, because performance is something you can measure and improve.
We also believe in transparent ownership. Your analytics account, your tracking setup and your site deliverables should belong to you. That way, whoever helps you next can pick up where the last person left off.
The point of all of it is the next action: fix the slow page, rewrite the weak call to action, double down on the channel that brings leads. A dashboard that never changes what you do is just decoration.
Donovan Wells - Founder and CEO
Common setup mistakes to avoid
Most analytics problems are mundane. Check these before you question the numbers:
- No defined goals. If you cannot say what a conversion is, no report will tell you.
- Counting the wrong action. Tracking a button click instead of a successful submission inflates leads.
- Ignoring your own visits. Staff browsing the site can distort a small site’s numbers. Filter internal traffic where you can.
- Too many metrics. A dashboard with 30 numbers gets ignored. Keep it to what answers your goals.
- Changing five things at once. You will not know which one worked.
- Forgetting a redesign’s effect on tracking. New templates can silently drop tags. Before a relaunch, use a checklist like our website redesign checklist for preserving SEO, and retest every key event after launch.
For search-driven businesses, analytics and SEO feed each other: reports show which queries and pages earn visits, and SEO work grows the traffic worth measuring. Our piece on SEO for business and long-term growth explains how that loop works over time.
Get help setting up tracking that you own
If you want analytics configured correctly the first time, with key events mapped to your real goals, a fast site underneath and reports you can read in ten minutes, that is work we do for businesses of all sizes as part of website development, redesign and SEO. Tell us what a good month looks like, and we will help you measure it.

See how we can help on Depeche Code, or tell us about your site and goals and we will suggest where to start.
FAQ
Is Google Analytics free for small businesses?
Yes. Google’s beginner guide for small businesses walks you through creating a property, adding a data stream and tag, browsing reports and setting up conversions. Most small sites never need anything beyond the standard free setup.
What are the most important metrics for a small business website?
Start with traffic sources, visitor counts, engagement (bounce rate, pages per session), conversions (form submissions, purchases, downloads) and page-load speed. Choose one metric per group and connect it to a business goal. Add more only when a specific question calls for it.
How do I track form submissions or purchases?
Send GA4 events that match the action: generate_lead for form or information requests, purchase for completed orders. Then mark those events as key events so reports show how many users completed them and which channels brought them. Test the form yourself to confirm the event fires on success.
How often should I check my analytics?
A short weekly check for problems and a longer monthly review works for most small businesses. After you change a page or campaign, look at its numbers again a few weeks later to see whether the change helped, and keep refining from there.
Is traffic the best measure of website success?
No. Digital.gov cautions against judging a site by traffic alone. What matters is whether visitors can complete the tasks your business cares about, such as contacting you or buying. Track conversions next to visits.
Sources
- Website Analytics Guide: Turn Data Into Business Results, U.S. Chamber of Commerce
- An introduction to analytics, Digital.gov
- Measuring Website and Social Media Engagement, Penn State Extension
- The Practical Google Analytics Guide for Small Businesses, SCORE
- Overview of Google Analytics reports, Analytics Help
- Analytics for beginners and small businesses, Google
- GA4 Recommended events, Analytics Help
- Key events vs. conversions in Google Analytics, Analytics Help
- Measure your digital performance, business.gov.au
- Data Analytics for Small Businesses: How to Manage Privacy Risks, NIST