

Core Web Vitals are three measurable signals, Largest Contentful Paint, Interaction to Next Paint, and Cumulative Layout Shift, that Google uses to judge page experience. A page earns a “good” rating when it hits LCP at or under 2,500 milliseconds, INP at or under 200 milliseconds, and CLS at or under 0.1, measured at the 75th percentile. They shape rankings alongside content quality, never in place of it.
TL;DR:
- Improving LCP should focus on reducing server response times, optimizing images, and preloading key assets, especially on high-traffic pages.
- Prioritizing improvements to INP involves deferring or slimming down JavaScript and offloading heavy processing tasks to enhance responsiveness.
- Fixing CLS requires reserving space for content and avoiding layout shifts caused by ads or dynamically injected elements.
- Changes made may take up to four weeks to reflect in Search Console due to the 28-day rolling data window, so faster validation needs real-user monitoring.
- A focus on site-wide templates rather than individual pages ensures that fixes address root causes rather than superficial symptoms.
Table of Contents
- Core Web Vitals: what LCP, INP and CLS measure and why the 75th percentile matters
- Why Core Web Vitals matter for SEO impact on rankings
- Measuring CWV: field data, lab tools, and the CrUX window
- Practical optimization checklist for LCP, INP and CLS
- Monitoring and validation after you ship a fix
- Depeche Code’s approach to Core Web Vitals work
- Balancing engineering effort against SEO and conversion payoff
- How Depeche Code helps with Core Web Vitals and performance
- Sources
- FAQ
Core Web Vitals: what LCP, INP and CLS measure and why the 75th percentile matters
LCP tracks how long it takes the largest visible element, usually a hero image, a video poster, or a block of text, to render. Slow servers, unoptimized images, and render-blocking CSS are the usual culprits.
INP replaced First Input Delay in 2024 and measures responsiveness across every click, tap, or keypress during a visit, not just the first one. Because INP reports the longest observed interaction rather than an average, a single sluggish dropdown or slow-loading form can drag an otherwise fast page into “poor” territory.
CLS scores unexpected movement on the page, like a banner ad pushing a button down right as a visitor tries to tap it. The score multiplies how much of the viewport shifted (impact fraction) by how far it moved (distance fraction).
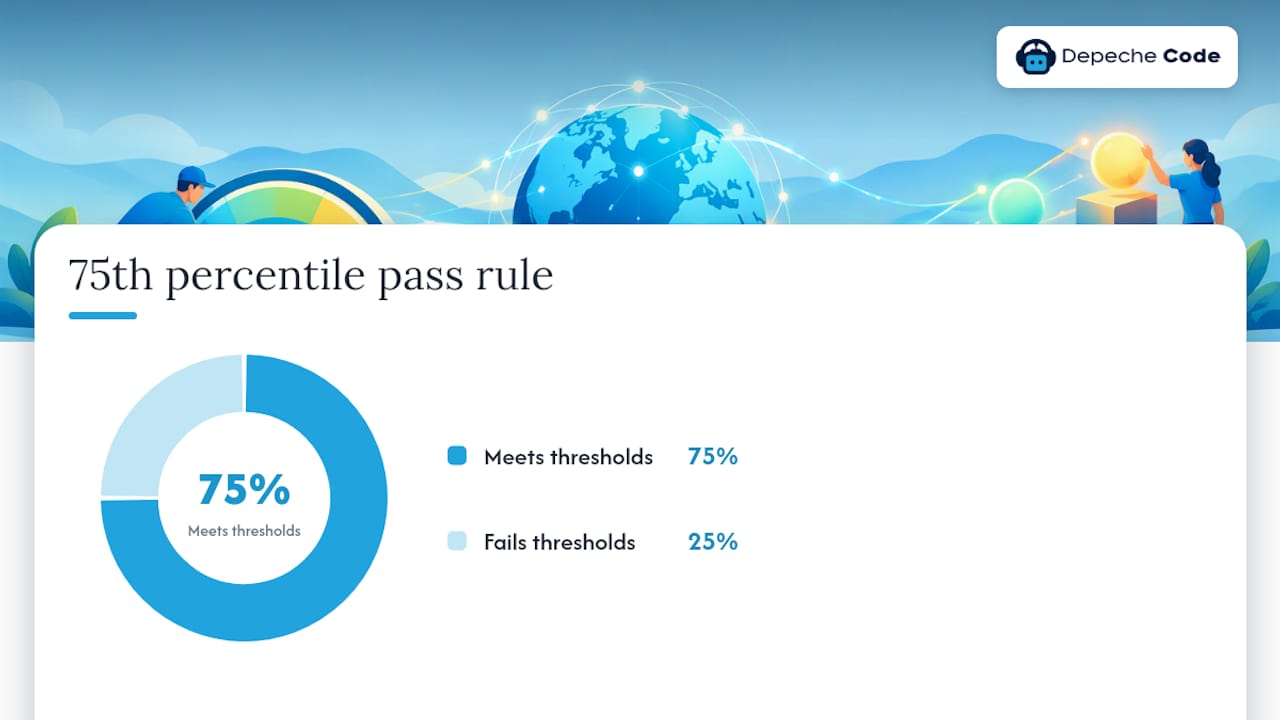
Google does not grade a page by its best moment. It uses the 75th percentile of real visits over a rolling period, so:
- A page is “good” only when 75% or more of its visits meet all three thresholds.
- One bad connection or one slow device among many fast ones will not sink a page’s rating.
- Consistency across visitors matters more than a single fast test result.
Why Core Web Vitals matter for SEO impact on rankings
Core Web Vitals sit inside what Google calls page experience signals, a category that also touches mobile-friendliness and security. Content relevance, search intent match, and authority still carry far more weight in how pages get ranked. Google itself frames good Core Web Vitals scores as helpful, not decisive, and warns that strong scores do not guarantee a ranking boost.
Where Core Web Vitals tend to matter most is in tight competition: two pages targeting the same query with similar topical depth, where a faster, more stable experience becomes the tiebreaker. Outside of ranking, the more tangible payoff is behavioral. A page that stops jumping around while loading keeps visitors from bouncing off in frustration, and a faster interaction response tends to keep people engaged longer.
Pro Tip: Treat Core Web Vitals work as a conversion project first and an SEO project second: the ranking upside is real but modest, while the usability gains show up immediately in session data.
Measuring CWV: field data, lab tools, and the CrUX window
Two very different kinds of data get lumped under “Core Web Vitals,” and mixing them up leads to wasted effort.
Field data comes from the Chrome User Experience Report (CrUX), built from real visits by actual Chrome users, and it is what Search Console’s Core Web Vitals report reads from. This is the data tied to ranking signals. Lab data, produced by PageSpeed Insights and Lighthouse, runs a single simulated page load under controlled conditions. Lab tools are excellent for diagnosing exactly what’s slow, but a good Lighthouse score does not guarantee a good field score.
- Use PageSpeed Insights or Lighthouse for diagnosis: they show which resource is blocking LCP or which script is delaying INP.
- Use Search Console’s Core Web Vitals report to see what real visitors actually experienced, aggregated over a rolling 28-day window.
- Add the web-vitals JavaScript library or a RUM provider when you need faster feedback than the 28-day window allows, since Web rather than waiting on CrUX.
- Reach for WebPageTest when you need a deeper waterfall view of exactly where milliseconds are going.
Most analytics platforms either support Core Web Vitals natively or can be configured to log custom events from the web-vitals library, so instrumentation rarely requires building anything from scratch.
Practical optimization checklist for LCP, INP and CLS
Start with the pages that carry commercial weight, product pages, service pages, landing pages tied to campaigns, since fixes there move both revenue and rankings faster than fixes on low-traffic blog posts.
- Cut LCP by shortening the path to your biggest element. Serve through a CDN, reduce Time to First Byte, preload the LCP image or font with a
<link rel="preload">tag, and compress images into WebP or AVIF with responsivesrcsetsizing. - Cut INP by keeping the main thread free. Break long JavaScript tasks into smaller chunks, defer or lazy-load scripts that are not needed for the first interaction, offload heavy computation to a web worker, and keep event handlers lean.
- Cut CLS by reserving space before content arrives. Set explicit width and height attributes or use the CSS
aspect-ratioproperty on images and embeds, load ads and third-party widgets into pre-sized containers, and never inject new content above something the visitor is already looking at.
On WordPress specifically, plugin bloat is the most common source of all three problems. Audit installed plugins and remove anything not actively used, defer plugin-added scripts that don’t run above the fold, extract critical CSS so the theme renders visible content immediately, and preload the hero image on template pages.
Roll out fixes in stages rather than all at once. Deploy to a small set of representative templates first, confirm the change in lab tools, then expand site-wide and watch field data over the following weeks.
Pro Tip: Fix LCP first, then INP, then CLS: LCP issues are usually the easiest to diagnose and the most visible to Google’s field data, so early wins there build momentum for the harder JavaScript work on INP.
Monitoring and validation after you ship a fix
Search Console’s Core Web Vitals report does not update in real time. Because CrUX aggregates data over a rolling 28-day window, a fix shipped today may not show as resolved for up to four weeks. Search Console’s “Start Tracking” button, available once you mark an issue as fixed, opens a dedicated 28-day validation window rather than shortening the wait.
A page’s Core Web Vitals status in Search Console reflects a rolling 28-day average of real Chrome user visits, not the result of your last deploy. That single fact explains most of the confusion teams have about why a fix “isn’t working” the day after launch.
To verify improvements faster than CrUX allows:
- Instrument the web-vitals JS library or a RUM provider to get per-visit telemetry within hours, not weeks.
- Compute the 75th percentile server-side from raw samples rather than relying on client-side approximations, which can mislead under sampling variability.
- Fix the root cause across an entire URL group or template, since Search Console groups similar URLs together and won’t clear a group from partial fixes.
Depeche Code’s approach to Core Web Vitals work
Depeche Code treats Core Web Vitals as a diagnostic-then-build process: lab tools identify the specific bottleneck, RUM data confirms it’s happening to real visitors, and development sprints tackle LCP first, then INP, then CLS, in that order. Commercial pages get prioritized because that’s where a faster experience translates most directly into conversions.
The fastest way to lose a fix’s benefit is to fix a template and never confirm it against real visitor data.
— Donovan Wells – Founder and CEO
Balancing engineering effort against SEO and conversion payoff
Not every template deserves the same investment. A checkout page or lead form justifies deep INP work; a static about page usually doesn’t. Chase the fixes that touch pages people convert on, not every page equally, and pair every Core Web Vitals change with a look at your analytics: a faster page that doesn’t move engagement or conversion metrics was a lower priority than it felt like at the time.
How Depeche Code helps with Core Web Vitals and performance
Diagnosing a slow LCP element or a layout shift is one thing. Rebuilding the template, restructuring plugin usage, and monitoring the result over weeks is a different kind of project, and it’s the kind Depeche Code runs regularly through its website development and SEO work.

Services include performance-focused website builds and redesigns, WordPress hosting and maintenance plans for ongoing stability, and SEO plans that treat Core Web Vitals as one input among many. If your Search Console report has been stuck on “needs improvement” for longer than you’d like, request an audit through the full services page to see what a prioritized fix plan would look like for your site.
Sources
Google’s own documentation on Core Web Vitals thresholds and page experience signals is the primary reference for definitions and ranking context. For measurement guidance, see web.dev’s field measurement best practices and the INP documentation. For hands-on testing, use PageSpeed Insights, Lighthouse, or WebPageTest for waterfall-level diagnosis. For a deeper practitioner walkthrough, see this Core Web Vitals guide for developers and SEO pros.
- Best practices for measuring Web Vitals in the field
- Google’s Core Web Vitals ranking signal (Search Engine Journal)
FAQ
What are the three Core Web Vitals metrics?
The three metrics are Largest Contentful Paint (loading speed), Interaction to Next Paint (responsiveness), and Cumulative Layout Shift (visual stability). Google recommends LCP under 2,500 milliseconds, INP under 200 milliseconds, and CLS under 0.1 for a “good” rating.
Does improving Core Web Vitals guarantee a ranking boost?
No. Core Web Vitals are part of the page experience signal, which factors into rankings alongside content relevance and authority, but relevance still carries far more weight than speed or stability scores.
How long does it take for Core Web Vitals fixes to show in Search Console?
Search Console pulls from CrUX, which aggregates real visits over a rolling 28-day window, so a fix can take up to four weeks to appear as resolved even after it’s live.
What’s the difference between field data and lab data for Core Web Vitals?
Field data, from CrUX and Search Console, reflects what real visitors actually experienced and is what ranking signals use. Lab data, from Lighthouse or PageSpeed Insights, is a single simulated test useful for diagnosis but not a substitute for real-world results.
Do mobile and desktop Core Web Vitals get scored the same way?
Search Console and CrUX report mobile and desktop as separate data sets because device performance and network conditions differ significantly between them. A page can pass on desktop while failing on mobile, so both need to be checked independently against the same 75th percentile thresholds.