
// Creative Agency
B2B Website Analytics: 5 Metric Groups to Track in 2026

B2B website analytics is the practice of collecting data on how business buyers find, read and act on your site, then connecting that activity to leads and revenue. The best setup is simple: track a short list of metrics, send form submissions into a CRM, and fix the pages where buyers drop off. The data is only as good as the website underneath it, which is why fast, well-built pages and clean lead capture come first.
TL;DR
- Track five groups of metrics: traffic, engagement, conversions, performance and pipeline. Five groups are enough to run a B2B site.
- Google Analytics 4 (GA4) shows where visitors come from and what they do, but long B2B sales cycles need your CRM to close the loop on revenue.
- Most anonymous visitors will stay anonymous, so build forms, offers and chat that give buyers a reason to identify themselves.
- U.S. privacy rules are state by state and getting stricter, so configure consent before you add tracking tags.
- Review the numbers monthly, change one thing at a time, then measure again.
Table of Contents
- What B2B website analytics actually measures
- The five metric groups worth tracking
- What GA4 can and cannot tell a B2B business
- Why most B2B visitors stay anonymous
- A 30-day setup plan
- Privacy rules that shape your tracking
- Turning the numbers into site improvements
- Where Depeche Code fits
- Our perspective
- FAQ
- Sources
What B2B website analytics actually measures
The U.S. Chamber of Commerce defines website analytics as collecting and analyzing data about how people interact with a website: traffic, behavior and conversions. The goal is to improve marketing, content and customer experience.
B2B adds two complications. First, a buyer is rarely one person. A purchase involves an operations lead who finds you, a manager who reads your case studies and a finance contact who looks at pricing, often across weeks and on different devices. Second, the sale happens offline or in a CRM, long after the first visit. So a B2B analytics setup has to answer questions a consumer store never asks:
- Which channels bring the visitors who later become real opportunities, not just clicks?
- Which pages do serious buyers read before they get in touch?
- Where do qualified visitors leave without acting?
If your reports cannot answer those three, you have a traffic counter, not an analytics program.
The five metric groups worth tracking
The Chamber lists four core categories: traffic, engagement, conversions and performance. For a B2B business, add a fifth: pipeline. Here is what goes in each and what to do with it.
| Group | What to track | The question it answers |
|---|---|---|
| Traffic | Total visitors, unique users, traffic sources | Which channels send people? |
| Engagement | Bounce rate, pages per session, time on site | Do visitors find the content useful? |
| Conversions | Conversion rate, form submissions, downloads | Are visitors taking the next step? |
| Performance | Page load time and site speed | Is the site itself costing you leads? |
| Pipeline | Qualified leads by source, opportunities, sales cycle length | Which marketing produces revenue? |
The first four groups come from the Chamber’s website analytics guide. The fifth lives mostly in your CRM, not in your analytics tool, which is the point of the next section.
Traffic: sources matter more than totals
A total of 5,000 monthly visitors says little. Split it by source: organic search, paid ads, referrals, social and direct. A B2B site with 800 visitors from organic search and a handful of leads may be healthier than one with 5,000 visitors from a viral post and none. Look at which sources feed your conversion numbers, then put budget there.
Engagement: look at the pages that signal intent
Bounce rate, pages per session and time on site are useful, but read them page by page. A short visit to a contact page is fine. A short visit to a pricing or services page is a problem. Create a list of your high-intent pages (services, pricing, case studies, contact) and review their engagement separately from your blog.
Conversions: define what counts
In B2B, a conversion is not a purchase. It is a form submission, a quote request, a booked call, a downloaded buyer’s guide or a chat that captures an email address. Set each up as a named event, and keep the list short. If everything is a conversion, nothing is.
Performance: slow pages quietly drain leads
Page load time is a metric group in its own right. A buyer who waits on a slow service page will not tell you why they left, they simply leave. Check your load times on mobile as well as desktop, because many business buyers do their first research on a phone. Our guide on how user experience drives website conversions covers the design side of the same problem.
Pipeline: connect the site to the CRM
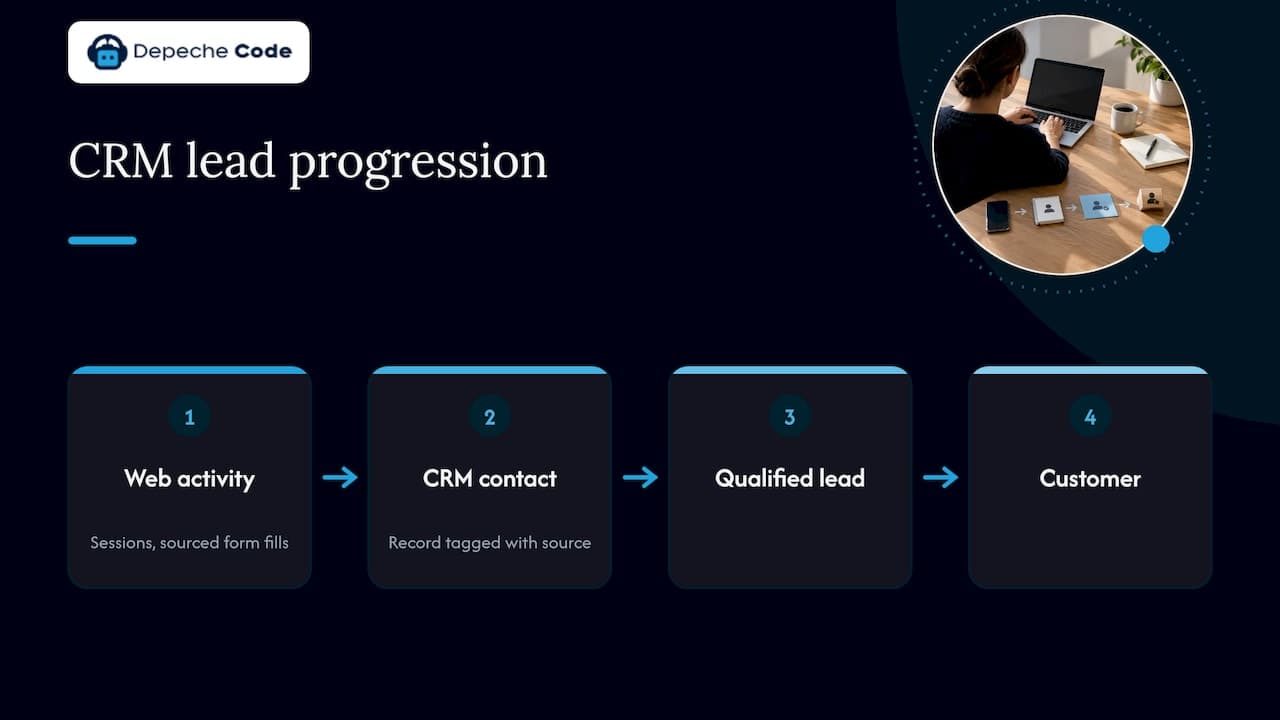
Sessions and form fills are the front half of the story. The back half is whether those leads became qualified, then became customers. That needs your CRM and your website sharing data. The simplest version is a form that creates a contact record tagged with its source. Our CRM and website integration playbook walks through how small businesses do this and when to scale up.
What GA4 can and cannot tell a B2B business
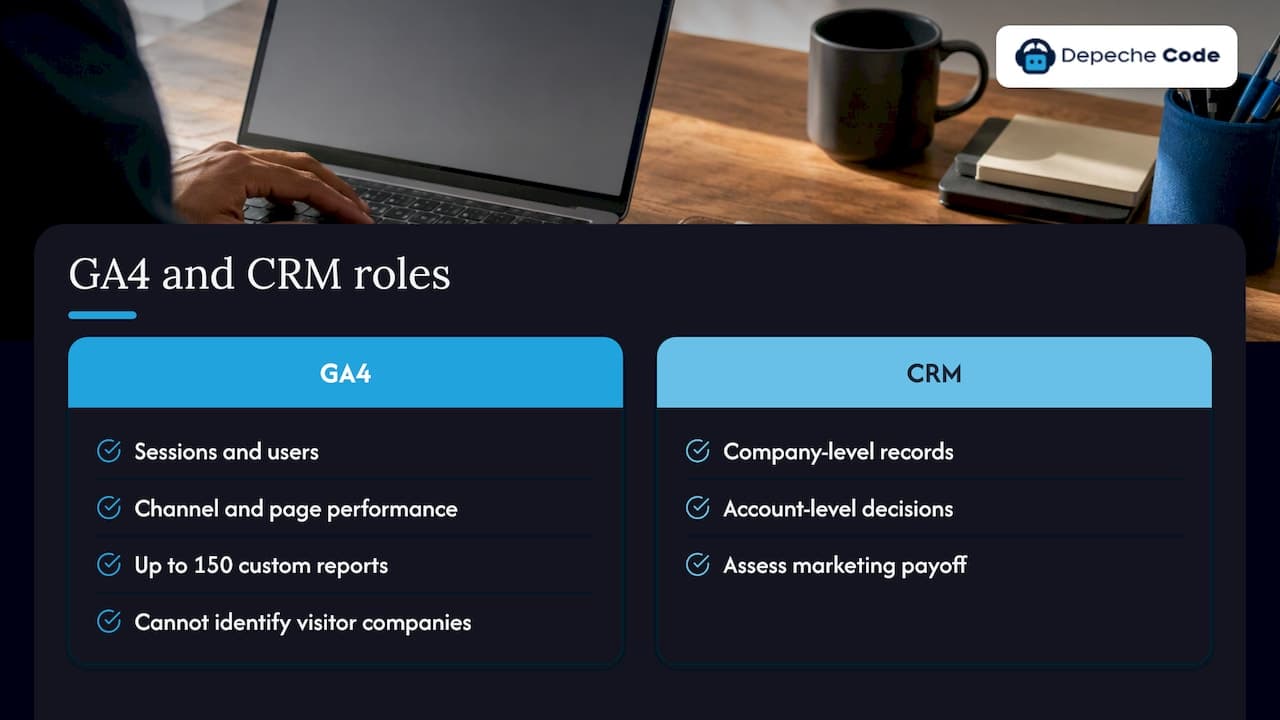
Google Analytics 4 is the default starting point. According to Google’s own GA4 Reporting Playbook, its reports cover active users, engagement time, pages and screens, landing pages, technology details, audiences, acquisition and conversions, plus cross-channel data-driven attribution. Properties can have up to 150 custom reports, so you can build a view that shows only the pages and sources your sales team cares about.
Two limits are worth knowing before you rely on it.
Thresholding. The same playbook explains that reporting thresholds are applied to prevent anyone from inferring the identity of individual users. At a granular level, that can make a report look incomplete. Search Engine Land quotes Google on this and lists the usual workarounds: turning off Google Signals, using device-only reporting or exporting to BigQuery. If a small-segment report looks too low, thresholding is the first suspect.
Company-level visibility. GA4 tells you about sessions and users, not about which company a visitor works for. It is excellent for channel and page performance. For account-level decisions, you need your CRM records, which is why we treat GA4 as one half of the picture.
A practical rule: use GA4 to decide what to fix on the site, and use the CRM to decide whether the marketing is paying for itself.
Why most B2B visitors stay anonymous
Many tools promise to reveal which companies visit your site. They can help, but set expectations accordingly. The reliable identification you get is the one visitors give you: a form submission, a booked call, a chat conversation where they leave an email address.
That shifts the work back to your website. Ask what a busy buyer would need to see before handing over their details, then build it:
- A contact form with few fields. Every extra field lowers completion.
- A clear next step on every service page, not just in the footer.
- A downloadable resource worth an email address, such as a checklist or buyer’s guide.
- A chat option on pages where buyers have questions, so that an anonymous visit can become a named lead.
When a visitor does identify themselves, make sure the lead record carries their traffic source and first landing page. That is the step that lets you say, months later, which content started the deal. Our article on B2B website conversion shows how to turn a typical conversion rate into pipeline.
A 30-day setup plan
You do not need an enterprise stack. A small or mid-sized B2B company can have a working system in a month.
- Days 1 to 3: write your questions. List the five questions your sales team and leadership ask most, such as which channels bring qualified leads or which service page converts best. Every metric you track should answer one of them.
- Days 4 to 7: install GA4 and define conversions. Mark form submissions, quote requests, calls and downloads as conversion events. Name them clearly so anyone can read the report.
- Days 8 to 12: standardize campaign tags. Use consistent UTM parameters (the tags added to links so that analytics can tell a LinkedIn post from an email). Inconsistent naming is the most common reason source reports turn into a mess.
- Days 13 to 18: connect forms to your CRM. Each submission should create a contact with its source attached. If you do not have a CRM yet, start with a simple one and expand later.
- Days 19 to 24: build one dashboard. Put the five metric groups on a single page. Resist adding more.
- Days 25 to 30: hold the first review with sales. Fifteen minutes is enough: which leads were good, which source sent them, which page did they read?
Then repeat monthly. The Chamber’s recommended loop is to identify patterns, make small targeted changes, then measure and refine, aiming at return on investment instead of raw traffic. Change one thing at a time so you know what worked.
For smaller teams, our guide to small business website analytics covers a lighter version of this list.
Privacy rules that shape your tracking
There is no single U.S. cookie law. Instead, a patchwork of state laws applies depending on where your visitors live. According to a January 2026 review by Stinson LLP, 20 states were actively enforcing comprehensive privacy laws, and online privacy lawsuits rose from just over 200 in 2023 to nearly 4,000 in 2024. The same review notes that online tracking claims have also been filed against B2B companies, so being a business-to-business company is no shield.
What that means in practice:
- Configure consent before tags fire. Analytics and advertising pixels should respect a visitor’s opt-out choice. Our guide to U.S. cookie consent for site owners explains how to honor browser opt-out signals such as Global Privacy Control before pixels load.
- Treat business contacts as covered. California’s rules apply to more than consumers. If you serve California contacts, review our CCPA compliance checklist for websites to see what your site needs.
- Record what you collect. A privacy policy that matches your actual tags is the minimum. Audit your tag list at least once a year, since marketing tools get added and forgotten.
These are general business guidelines, not legal advice. For your specific obligations, speak with a privacy attorney.
Turning the numbers into site improvements
Analytics pays off when it produces a to-do list. Here is how common findings translate into action:
| What the data shows | Likely cause | What to change |
|---|---|---|
| High traffic, few form fills | Weak calls to action or a long form | Add a clear next step and cut form fields |
| Visitors leave a service page quickly | Slow load or unclear message | Compress images, tighten the headline |
| Good organic traffic, poor lead quality | Content attracts the wrong audience | Rewrite pages around buyer problems |
| Mobile conversion far below desktop | Layout or speed problems on phones | Redesign the mobile experience |
| Leads from forms never reach sales | Disconnected form and CRM | Integrate and tag every submission |
Notice that four of the five fixes are website work, not reporting work. This is the real lesson of B2B analytics: the report shows the problem, and the site is where you solve it.
Where Depeche Code fits
If your numbers point to a slow, outdated or poorly structured site, that is work we do. Depeche Code is an Orlando-based agency that handles website design and redesign, SEO, WordPress hosting and maintenance, AI chatbots, social media management and a CRM. Our WordPress Dedicated Hosting starts from $39 per month and WordPress Maintenance from $99 per month. Our AI chatbot plans start from $49 per month with a one-off $299 setup and integration fee, which gives visitors a way to start a conversation on your key pages. You keep ownership of all deliverables.
See what we offer on our services page.
We measure our own work by technical performance, using Google PageSpeed and SEO scores, which are the same performance and traffic signals covered above.
Our perspective
We see the same pattern in B2B analytics again and again: companies buy more tools when the real problem is the website feeding them. A dashboard cannot make a slow service page persuasive or a long contact form short.
Our view is to start with the foundation. A fast, clearly organized site built on a platform you own, with SEO that brings in the right searches, gives every metric in this article something worth measuring. Then connect the forms to a CRM so each lead carries its source, and add chat where buyers have questions.
We build with in-house directed AI to deliver faster, and we judge the result by performance scores and by whether the site produces conversations with real buyers. Analytics should end in a decision, and the decision is usually a change to the site.
Donovan Wells - Founder and CEO
FAQ
What is B2B website analytics?
It is the collection and analysis of data about how business buyers interact with your site: where they come from, what they read and whether they take action. For B2B, it should also connect those visits to leads and revenue in your CRM, since sales cycles are long and involve several people.
Can Google Analytics measure B2B website traffic?
Yes. GA4 reports on users, engagement, landing pages, acquisition sources and conversions, and it offers cross-channel data-driven attribution, according to Google’s reporting playbook. It does not tell you which company a visitor works for, so pair it with CRM data to see pipeline and revenue.
Which metrics should a small B2B company track first?
Start with traffic by source, engagement on your service pages, form submissions and page speed. Add qualified leads by source once your forms feed a CRM. Those five groups answer most owner questions without a heavy tool stack.
How often should I review my analytics?
Monthly is a good rhythm for most B2B sites, with a short review alongside sales. Make one change at a time between reviews so you can see its effect. Check consent settings and tags at least once a year.
Sources
- Website Analytics Guide: Turn Data Into Business Results, U.S. Chamber of Commerce
- Google Analytics 4 Reporting Playbook, Google
- 6 reasons your GA4 reports aren’t adding up, Search Engine Land
- A New Era of Comprehensive Privacy Laws and the Surge in Privacy Litigation, Stinson LLP