

Social media ROI (%) equals (Return − Investment) ÷ Investment × 100. That single formula, applied correctly, is the difference between guessing your social budget works and proving it to a CFO.
The five-step workflow behind it stays the same whether you run a five-person marketing team or a national brand: define the goal, map the metrics to that goal, tally every cost, calculate the value generated, and apply the formula with a confidence label attached. Skip any step and the number you hand to leadership won’t survive a hard question.
Here’s the workflow in order:
- Define the goal. Awareness, leads, or sales. Pick one primary objective per campaign.
- Map the metrics. Match KPIs to that goal instead of reporting everything you can pull.
- Tally the costs. Ad spend, content production, staff hours, tools, and agency fees all belong in the denominator.
- Calculate the value. Use measured revenue where you have it, modeled pipeline value where you don’t, and estimated equivalents for brand outcomes.
- Apply the formula and report it. Attach a confidence tier and share it monthly or quarterly, a cadence Hootsuite recommends for keeping stakeholders current.
Before you calculate anything, do three things: tag every outbound link with UTM parameters, open Google Analytics 4 and your CRM side by side, and copy this sample UTM structure: ?utm_source=instagram&utm_medium=social&utm_campaign=spring_launch.
Key Takeaways
Social media ROI only holds up under scrutiny when it separates measured revenue from modeled and estimated value, and when every cost, not just ad spend, is counted.
| Point | Details |
|---|---|
| Use the full formula | Calculate (Return − Investment) ÷ Investment × 100, including content and labor costs in Investment. |
| Separate ROAS from true ROI | Report both: ROAS for ad optimization, full ROI for channel budget decisions. |
| Label your confidence tier | Tag every ROI figure as Tier 1 (measured), Tier 2 (modeled), or Tier 3 (estimated). |
| Match KPIs to funnel stage | Track impressions for awareness, engagement for consideration, and conversions for revenue goals. |
| Get help building the system | Depechecode sets up GA4 tracking, UTM discipline, and dashboards so ROI reporting runs without manual spreadsheet work. |
Table of Contents
- What Is Social Media ROI and Why Does It Matter?
- Why Is Social Media ROI So Hard to Measure?
- Step-By-Step: How to Calculate Social Media ROI
- Which Metrics Should You Track for Each Goal?
- Which Attribution Model Should You Use?
- How Do You Put a Dollar Value on Non-Monetary Outcomes?
- Which Tools Actually Unify Social ROI Data?
- What Counts as a Good Social Media ROI?
- How Do You Present ROI to Stakeholders?
- What Quick Changes Actually Improve Social Media ROI?
- Three Worked ROI Calculations, Side By Side
- Implementation Checklist and Template
- Why Most ROI Reports Fail Before the Math Even Starts
- How Depechecode Helps You Build a Social ROI System
- Sources
- FAQ
What Is Social Media ROI and Why Does It Matter?
Social media ROI measures the financial return generated by your social activities relative to what you spent to produce it. The formula, restated in business terms: Return is the value your social work generated, and Investment is everything it cost to generate that value, not just your ad spend. Leaving out content production and staff hours is the most common way marketers inflate their own numbers.
Two examples show why this matters beyond a spreadsheet exercise. A subscription box company that ties Instagram-driven signups to 12-month customer lifetime value can justify a bigger retainer than one that only reports likes. A B2B software firm that connects LinkedIn engagement to closed-won deals in its CRM gets budget renewed; one that reports follower growth alone often doesn’t.
Executives fund what they can trace to revenue or retention. Three things back that up:
- GA4 lets you attribute site conversions back to the social session that started them.
- Social listening platforms like Brandwatch quantify sentiment and share of voice as a leading indicator of demand.
- Statista’s social commerce market data signals that revenue-generating social activity is growing, not shrinking, which raises the stakes for measuring it accurately.
Why Is Social Media ROI So Hard to Measure?
Measuring social ROI honestly is harder than the formula suggests, and pretending otherwise is how marketing teams lose credibility with finance. Several structural problems get in the way before you even open a spreadsheet.
- Multi-touch attribution. A buyer might see three Instagram ads, click a LinkedIn post, and convert two weeks later from a Google search. Last-click credit gives Google the win and social gets nothing.
- Delayed conversions. B2B sales cycles routinely run 60 to 90 days or longer, so a campaign’s true impact often lands outside the reporting window you’re judged on.
- Dark social. Links shared in private messages, group chats, and DMs show up as “direct” traffic in analytics, hiding the social origin entirely.
- Privacy-driven data loss. iOS tracking restrictions and the decline of third-party cookies have degraded platform-reported attribution accuracy across the board.
- Siloed tools. Ad platforms, CRM, and analytics rarely talk to each other without manual work, so numbers get reconciled by hand or not at all.
There’s a second, quieter problem: undercounting costs. If you only divide revenue by ad spend, you get Return on Ad Spend (ROAS), not true ROI. A campaign that shows 400% ROAS can look very different once you add the freelance videographer, the fifteen hours your coordinator spent scheduling, and the $99-a-month tool subscription. Calculover’s breakdown of ROAS versus full ROI makes this distinction a governance issue, not a nitpick: finance teams that only see ROAS routinely approve budgets that lose money once labor is priced in.
Pro Tip: Run both numbers side by side in every report: ROAS for optimizing ad creative in real time, and full ROI (including labor and content costs) for deciding whether a channel deserves more budget next quarter.
Step-By-Step: How to Calculate Social Media ROI
This is the process, expanded into something you can actually run this month, and the five-step process Hootsuite outlines maps directly onto it.
Step 1: Define the business goal and conversion. Decide what counts as a win before launch. For an e-commerce brand, that’s a completed purchase. For a B2B team, it might be a demo request or a marketing-qualified lead. Write the definition down so nobody argues about it after the campaign ends.
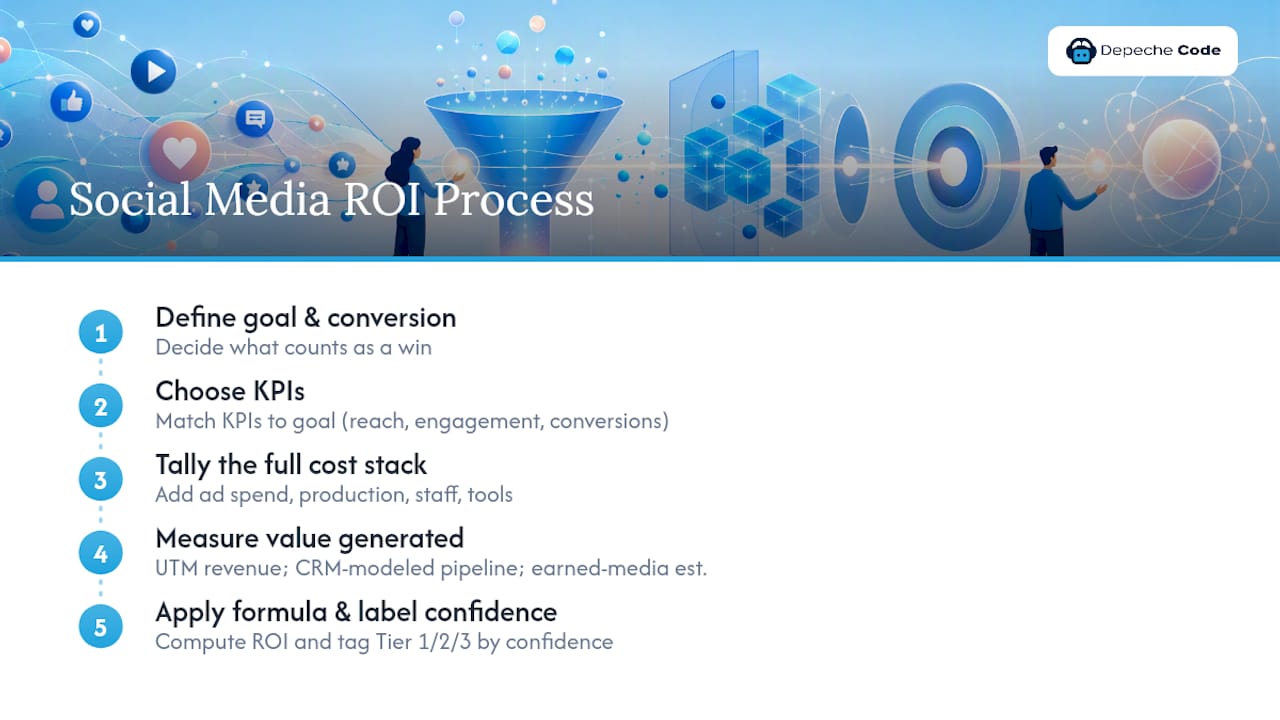
Step 2: Choose KPIs that map to that goal. Awareness goals need reach and impressions. Consideration goals need engagement rate and click-through rate. Conversion goals need conversions, cost per lead, and ROAS. Chasing follower count when your goal is revenue wastes a reporting cycle.
Step 3: Tally the full cost stack. Add ad spend, content production (design, video, copywriting), staff or agency time, and any paid tools or platform subscriptions. Brandwatch’s definition of the ROI formula explicitly calls out non-ad costs as part of the denominator, which is where most teams underreport.
Step 4: Measure the value generated. Combine traceable revenue from UTM-tagged conversions, modeled pipeline value from CRM-attributed leads, and, where relevant, an estimated earned-media value for reach you can’t directly monetize.
Step 5: Apply the formula and label your confidence. Once you have Return and Investment, run the math and tag the result Tier 1, 2, or 3 depending on how directly you measured the value, an approach Sydium recommends for keeping reports honest about what’s proven versus modeled.
Here’s a worked example using a mid-size e-commerce brand running a six-week Instagram and TikTok campaign:
The numbers: Ad spend was $8,000. Content production (four videos, ten static posts) cost $3,500. Staff time across a coordinator and a designer totaled roughly $2,000. Total investment: $13,500. UTM-tagged conversions in GA4 showed $28,000 in directly attributed revenue.
That means every dollar invested returned about $2.07 in revenue, a Tier 1 number because it’s built entirely on traceable, UTM-tagged purchases.
Here’s a basic template structure you can copy into a spreadsheet or connect to your GA4 and CRM exports:
Build this once, then reuse the structure for every campaign so quarter-over-quarter comparisons stay consistent.
Which Metrics Should You Track for Each Goal?
Every metric you report should trace back to a specific stage of the funnel, or it’s just noise in a deck. Shopify’s guidance on this point is blunt: choose KPIs that map to outcomes instead of chasing whatever number happens to be trending upward.
| Funnel Stage | Goal | Key Metrics | Measurement Source |
|---|---|---|---|
| Awareness | Build reach and recognition | Impressions, reach, follower growth | Native platform analytics |
| Consideration | Drive interest and engagement | Engagement rate, click-through rate, video completion rate | Native analytics, social listening tools |
| Conversion | Generate revenue or leads | Conversions, cost per lead (CPL), ROAS | GA4, CRM |
| Retention | Keep and grow customers | Repeat purchase rate, customer lifetime value | CRM, ecommerce platform |
Each metric answers a different question, and mixing them up is where reports lose credibility. Impressions tell you how many people saw your content, sourced straight from platform dashboards like Meta Business Suite or TikTok Analytics. Engagement rate tells you whether that content resonated enough to earn a reaction, useful for creative testing but weak as a revenue proxy on its own. Conversions and CPL, pulled from GA4 or your CRM, tell you whether the traffic actually did something valuable once it left the platform.
Different business models need different KPI sets:
- E-commerce brands should center on ROAS, cost per acquisition, and average order value from social-referred traffic.
- B2B lead generation teams should prioritize cost per lead, lead-to-opportunity conversion rate, and pipeline value attributed to social touchpoints in the CRM.
- Brand-growth-focused companies should track share of voice, sentiment trend, and follower quality (engagement rate relative to audience size) over raw follower count.
One habit worth adopting: review this mapping every quarter. Goals shift, and a KPI set built for a launch campaign rarely fits a retention-focused quarter six months later.
Which Attribution Model Should You Use?
Attribution decides who gets credit for a conversion, and picking the wrong model can make a high-performing channel look worthless on paper. Four models cover most situations.
Last-click attribution gives 100% of the credit to the final touchpoint before conversion. It’s simple and available in nearly every analytics tool by default, but it systematically undervalues social, which usually plays an earlier role in the journey rather than closing the sale directly.
Multi-touch attribution splits credit across every touchpoint a customer interacted with. It’s more accurate for long consideration cycles but requires more setup, typically a dedicated attribution tool or a well-configured GA4 property with cross-channel event tracking.
Data-driven attribution uses algorithmic modeling to weight touchpoints based on actual conversion patterns in your account. GA4 offers this natively, and it’s generally the best default for teams without the resources to build custom multi-touch models.
Incrementality testing holds out a control group that doesn’t see your social ads, then compares conversion rates against the exposed group. It’s the most rigorous way to prove causation rather than correlation, but it takes planning and enough volume to reach statistical significance, so it’s better suited to quarterly or annual checks than every campaign.
Getting the tracking foundation right matters more than which model you pick. Use this checklist:
- Tag every shared link with UTM parameters, a practice Brandwatch treats as non-negotiable for attributing revenue back to specific posts and campaigns.
- Set up GA4 custom conversion events for every meaningful action, not just purchases.
- Install platform pixels (Meta Pixel, LinkedIn Insight Tag) to feed conversion data back into ad platforms for optimization.
- Stitch CRM data to marketing source fields so sales-qualified pipeline connects back to the social touchpoint that started it.
- Run an incrementality test at least once a year or before a major budget reallocation decision.
On naming conventions: assign one person, usually a marketing operations lead, to own the UTM taxonomy. A consistent structure like utm_source=platform&utm_medium=social&utm_campaign=name_date prevents the fragmented, unsearchable mess that happens when five people tag links five different ways.
Pro Tip: Audit your UTM tags quarterly. Broken or inconsistent tagging is the single most common reason ROI numbers look worse than actual performance.
How Do You Put a Dollar Value on Non-Monetary Outcomes?
Not every valuable outcome from social comes with a receipt attached, and pretending otherwise produces reports nobody trusts. The fix is labeling, not guessing.
Use three confidence tiers, an approach Sydium recommends for exactly this reason: Tier 1 (measured) covers revenue you can trace directly through UTM-tagged conversions. Tier 2 (modeled) covers value you calculate from known inputs, like lead value, but haven’t directly observed as revenue yet. Tier 3 (estimated) covers proxy valuations for outcomes like reach or sentiment that have no direct revenue equivalent.
Three valuation methods handle most Tier 2 and Tier 3 situations:
- Lead value: average deal size multiplied by historical close rate gives you a defensible dollar value per lead, even before it closes.
- Customer lifetime value: Sprinklr’s framework for social ROI recommends applying CLV to new customers acquired through social rather than counting only their first purchase, which can understate the channel’s real value for subscription and repeat-purchase businesses.
- Earned-media-equivalent CPM: for reach you can’t tie to a conversion, estimate what that impression volume would have cost as paid media, then apply a discount factor to account for the lower certainty.
A quick example: a B2B firm generates 40 leads from LinkedIn in a quarter. Modeled lead value: 40 × $12,000 × 0.15 = $72,000. That number goes in the report as Tier 2, with the assumptions (deal size, close rate, and the time window used) listed alongside it so anyone can check the math.
Which Tools Actually Unify Social ROI Data?
No single tool covers the full ROI picture, and that’s exactly why most teams end up stitching data across four or five platforms.
Native platform analytics (Meta Business Suite, TikTok Analytics, LinkedIn Analytics) give you channel-level engagement and reach data straight from the source, but they stop at the platform’s edge. GA4 picks up from there, tracking what happens after the click: site conversions, custom events, and attribution across sessions. Your CRM closes the loop by connecting a lead captured on social to the revenue it eventually generates, which is the piece most dashboards miss entirely.

Social analytics platforms like Hootsuite, Sprout Social, and Brandwatch aggregate performance across channels and add listening capability, useful for catching sentiment shifts and share-of-voice trends that raw engagement numbers won’t show. HubSpot bridges the CRM and marketing side directly, making it a strong fit for B2B teams that need lead-to-revenue attribution without building custom integrations.
For a minimal reporting stack, most teams need: one native analytics source per platform, GA4 for site-side attribution, a CRM for revenue stitching, and a dashboard tool to pull it all into one view for stakeholders.
A useful dashboard should surface, at minimum:
- Headline ROI percentage with its confidence tier
- Channel-level breakdown (which platform drove what)
- Campaign-level ROAS
- Full cost breakdown (ad spend, content, labor)
Pro Tip: Start with two tools, not five.
What Counts as a Good Social Media ROI?
Benchmarks vary enough by industry and funnel stage that a flat number is close to useless without context. Paid social ROAS commonly ranges from 200% to 800% depending on the platform and product category, though Sprinklr’s research notes that organic-heavy strategies tend to show lower short-term ROAS but stronger long-term ROI once CLV is factored in.
A useful cadence: check active paid campaigns monthly, since ad performance shifts fast enough that quarterly reviews miss problems. Review organic programs quarterly, since content strategy and audience growth move more slowly. Run incrementality tests annually or around major budget decisions, since they take more setup than a monthly check justifies.
- Build your own internal benchmark first: compare this quarter’s ROI to last quarter’s before comparing yourself to an industry average.
- Treat published industry benchmarks as a sanity check, not a target, since they blend businesses at very different funnel stages and cost structures.
How Do You Present ROI to Stakeholders?
A number without a story gets questioned; a number with a clear structure gets approved. Build every report around the same five sections: an executive summary, a headline ROI figure with its confidence label, channel-level results, a full cost breakdown, and a short set of recommendations for next steps.
Visuals do more work than a table of numbers ever will. A KPI trend line shows whether ROI is improving or declining over time, which matters more to executives than any single quarter’s snapshot. A contribution waterfall chart, moving from total cost to total value generated, makes the ROI calculation visually obvious without requiring anyone to do math in their head. A simplified attribution funnel, showing how a customer moved from first social touch to final conversion, answers the “how did this actually happen” question before someone asks it.
Here’s a one-sentence executive summary template you can copy directly into a deck or email: “Our social media investment of [$X] generated [$Y] in [measured/modeled] value this quarter, a [Z%] ROI, driven primarily by [channel/campaign].”
- Lead with the headline number, not the methodology.
- Put the confidence tier next to every dollar figure, not buried in a footnote.
- Close with one specific recommendation, not a list of five.
Pro Tip: Executives remember the trend line more than the single number. If this quarter is down but the six-month trend is up, lead with the trend.
What Quick Changes Actually Improve Social Media ROI?
Small operational fixes move ROI faster than most campaign-level changes.
- Enforce UTM tagging on every single outbound link, with zero exceptions, before the next campaign launches.
- Double down budget on the creative formats already producing your best ROAS instead of splitting spend evenly across formats.
- Shift budget toward the channel with the strongest measured ROI, not just the one with the most impressions.
- Shorten the landing page path between an ad click and a completed conversion by at least one step.
- Repurpose top-performing assets across platforms instead of producing new creative for every post.
Pro Tip: Track staff time on social tasks for two weeks straight.
Pro Tip: Batch content production into one or two days a month instead of daily ad hoc creation. It cuts per-post cost and forces better planning.
Add one line to your next sprint planning session: “Confirm UTM tags are live before this campaign goes out.” That single checkpoint prevents the most common reporting gap.
Three Worked ROI Calculations, Side By Side
Seeing the three confidence tiers applied to real scenarios makes the labeling system click faster than any explanation.
- E-commerce, Tier 1 (measured). A skincare brand spends $6,000 on Instagram ads and content over four weeks. UTM-tagged links in GA4 show $19,000 in purchase revenue. ROI = ($19,000 − $6,000) ÷ $6,000 × 100 = 217%, fully traceable to actual transactions.
- B2B lead generation, Tier 2 (modeled). A software company spends $9,000 across LinkedIn ads and a content sprint, generating 25 CRM-logged leads. Average deal size is $15,000 with a 10% close rate, giving a modeled value of $37,500. ROI = ($37,500 − $9,000) ÷ $9,000 × 100 = 317%, labeled Tier 2 because the value is projected, not yet closed.
- Brand awareness, Tier 3 (estimated). A consumer brand spends $12,000 on a TikTok influencer push generating 4 million impressions. Using an earned-media-equivalent CPM proxy of $8, that’s roughly $32,000 in estimated value. ROI = ($32,000 − $12,000) ÷ $12,000 × 100 = 167%, flagged Tier 3 since it rests on a proxy, not a transaction.
The pattern across all three: the formula never changes, but the confidence label attached to the “Return” figure changes what you can claim about it in front of finance.
Implementation Checklist and Template
Turning this into a system your team actually runs takes assigning owners, not just writing a policy. Here’s a checklist you can hand to a project manager this week:
- Assign one owner for UTM tagging and naming conventions across every campaign.
- Build GA4 custom conversion events for each meaningful action (purchase, form fill, demo request).
- Map CRM lead source fields to match your UTM campaign names so revenue can trace back to social.
- Build a dashboard pulling headline ROI, channel breakdown, and cost stack into one view.
- Set a recurring monthly reporting cadence, with a quarterly deeper review of organic performance.
A minimal spreadsheet template needs these columns: campaign name, ad spend, content and labor cost, total investment, measured revenue, modeled value, estimated value, ROI percent, and confidence tier (Tier 1, 2, or 3). Naming your UTM campaigns consistently, something like campaignname_channel_date, keeps this spreadsheet queryable months later instead of a pile of inconsistent labels.
When something breaks: if revenue in GA4 doesn’t match CRM totals, check for duplicate UTM tags first. That mismatch causes more reporting headaches than any other single issue.
Pro Tip:
| Column | Purpose | Example |
|---|---|---|
| Campaign name | Unique identifier | spring_launch |
| Total investment | Full cost stack | $13,500 |
| Confidence tier | Data reliability | Tier 1 |
Why Most ROI Reports Fail Before the Math Even Starts
The biggest mistake I see in social ROI reporting isn’t a bad formula. It’s teams calculating ROAS and calling it ROI, then wondering why finance pushes back on the number six months later when the full cost picture surfaces.
The uncomfortable truth is that most marketing teams don’t want to know their true ROI, because it’s often lower than the ROAS number they’ve been reporting. Labor and content costs are inconvenient to add to a spreadsheet when the ad-only number already looks good. But a CFO who catches that gap once stops trusting every number that comes out of the marketing team afterward, which costs far more than a temporarily lower ROI figure ever would.
The three-tier confidence model matters more than any single tool on this list. It’s not about having perfect data. It’s about being honest about which numbers are measured, which are modeled, and which are educated guesses, and never letting Tier 3 estimates masquerade as Tier 1 revenue in front of the people approving next quarter’s budget.
How Depechecode Helps You Build a Social ROI System
Getting from a formula on a page to a working dashboard that pulls GA4, CRM, and platform data into one report takes technical setup most marketing teams don’t have time to build alone. That’s the gap Depechecode fills.
Depechecode sets up UTM-tagged tracking, builds GA4 conversion events mapped to your actual sales funnel, and connects the dashboard pieces so your headline ROI number updates without a manual spreadsheet pull every month. For teams that need ongoing content production and channel management alongside the tracking, Depechecode’s social media services cover both the execution and the reporting side, so the cost stack and the value generated live in the same system instead of two disconnected spreadsheets.
If your conversion funnel itself is the weak link, whether a slow landing page or a checkout flow that loses buyers before they convert, Depechecode’s website design and development team can fix that piece too, since a better ROI number sometimes starts with a better page, not a better ad.
Start with a tracking audit: request a review of your current UTM setup and GA4 configuration to see exactly where your attribution gaps are before your next campaign launches.
Sources
These sources back the methods and figures used throughout this guide:
For implementation help, Depechecode’s GA4 conversion tracking guide and social media management service page cover the setup work referenced throughout this article.
FAQ
How Do You Calculate ROI for Social Media?
Use the formula (Return − Investment) ÷ Investment × 100, where Return includes measured revenue plus modeled or estimated value, and Investment includes ad spend, content costs, and staff time.
What Is the 5-3-2 Rule on Instagram?
The 5-3-2 rule is a content mix guideline suggesting five posts share others’ content or curated value, three posts share your own original content, and two posts are personal or behind-the-scenes, though definitions of this rule vary across sources.
What Is the 5-5-5 Rule for Social Media?
The 5-5-5 rule generally refers to a content format guideline, such as keeping captions to five lines, using five hashtags, and posting five times a week, though practitioners apply the specifics differently depending on the platform.
Is a 2% ROI Good?
What’s the Difference Between ROAS and True ROI?
ROAS only divides revenue by ad spend, while true ROI adds content production and staff time to the cost side, which is why a campaign can show strong ROAS and still lose money once full costs are counted.