

Core Web Vitals are three field metrics, LCP, INP, and CLS, that measure how fast a page loads, how quickly it responds to interaction, and whether its layout stays stable while loading. Google evaluates these against fixed thresholds and surfaces the results directly in Search, which makes them a real, measurable signal rather than a vague notion of “site speed.”
The first move if you haven’t checked your scores this quarter: open Search Console’s Core Web Vitals report or run PageSpeed Insights against your homepage and a few key templates. Field data from the Chrome UX Report (CrUX) tells you what real visitors actually experienced, not what a lab simulation predicts.
Triage before you optimize. Chasing every metric at once wastes engineering time on pages nobody visits.
- Identify which metric is worst across your site (LCP, INP, or CLS rarely fail evenly).
- Compare mobile versus desktop. Mobile almost always lags because of network and CPU constraints.
- Focus first on your highest-traffic templates. A blog post with ten visits a month can wait.
Pro Tip: Don’t start by opening your homepage in Chrome DevTools. Start in Search Console’s Core Web Vitals report, sorted by URL group, so you’re fixing the pages that actually move the needle for real visitors.
Key Takeaways
Core Web Vitals succeed when teams measure with real-user CrUX data first, fix the worst-scoring pages by traffic priority, and verify every change against field data rather than a single lab score.
| Point | Details |
|---|---|
| Three metrics, one goal | LCP, INP, and CLS measure loading, responsiveness, and visual stability, each graded at the 75th percentile. |
| Thresholds are fixed | Good scores are LCP ≤2.5s, INP ≤200ms, CLS ≤0.1; anything worse needs triage. |
| Ranking signal, not a growth lever | Core Web Vitals gate rankings more than they boost them, so fix “Poor” pages before polishing “Good” ones. |
| Field data beats lab scores | CrUX and Search Console reflect real visitors; Lighthouse and PageSpeed Insights help you reproduce and debug. |
| Expect a monitoring lag | CrUX rolls on a 28-day window, so verified fixes take 4 to 6 weeks to show in Search Console. |
| Bring in expert help when needed | Depechecode audits CrUX data, prioritizes fixes by traffic, and monitors results after remediation. |
Table of Contents
- What Do LCP, INP, and CLS Actually Measure?
- What Score Counts as “Good” for Core Web Vitals?
- Why Do Core Web Vitals Matter for SEO and Business Metrics?
- How Do You Measure Core Web Vitals Correctly?
- How Do You Fix LCP, CLS, and INP Problems?
- What Should a Core Web Vitals QA Checklist Include?
- What Does a Reliable Monitoring Workflow Look Like?
- Should You Hire an Agency or Fix Core Web Vitals In-House?
- What Trade-Offs Come With Chasing Perfect Scores?
- How Depechecode Approaches Core Web Vitals Remediation
- What Resources Should You Bookmark for Core Web Vitals?
- Sources
- FAQ
What Do LCP, INP, and CLS Actually Measure?
Each Core Web Vital targets a different part of the page experience: how long the biggest thing takes to appear, how fast the page responds when someone interacts with it, and whether elements jump around while all of that happens.
Largest Contentful Paint (LCP) tracks the render time of the largest visible element in the viewport, usually a hero image, a large heading, or a background video poster. If your homepage has a big banner image above the fold, that image is almost certainly your LCP element. You can confirm it in Chrome DevTools’ Performance panel, which flags the LCP candidate directly in the timeline.
Interaction to Next Paint (INP) replaced First Input Delay (FID) in March 2024, and it’s a stricter test. Instead of only measuring the delay before the first click or tap gets acknowledged, INP tracks the longest meaningful interaction across the entire page visit. A dropdown menu that takes 300 milliseconds to open on the fifth click will hurt your INP score just as much as a laggy first click would have hurt FID.
Cumulative Layout Shift (CLS) quantifies unexpected movement. It’s the classic scenario of clicking a button just as an ad loads above it and shifts the whole page down. Common culprits: images without explicit dimensions, web fonts that swap in late (FOIT/FOUT), and third-party embeds or ads injected after the initial render.
A minimal fix for image-driven shifts:
<img src="hero.jpg" width="1200" height="600" alt="Product hero image">
Setting width and height (or using CSS aspect-ratio) lets the browser reserve space before the image loads, so nothing jumps when it arrives.
| Metric | What it measures | Typical causes | Quick repro tip |
|---|---|---|---|
| LCP | Time to render the largest visible element | Unoptimized hero images, slow server response, render-blocking CSS/JS | Check the “LCP” flag in Chrome DevTools’ Performance panel |
| INP | Responsiveness to user interactions across the full visit | Long JavaScript tasks, heavy event handlers, unoptimized third-party scripts | Interact repeatedly with menus/buttons while recording a trace |
| CLS | Visual stability during load and interaction | Missing image dimensions, late-injected ads, web font swaps | Slow your network in DevTools and watch for jumps |
What Score Counts as “Good” for Core Web Vitals?
Google grades each metric at the 75th percentile of page loads, which means three out of four visits need to hit the threshold before a page or origin gets labeled “Good.” The official thresholds are:
- LCP: Good at or below a threshold around 2.5 seconds, with higher values indicating worse performance.
- INP: Good at or below a threshold near 200 milliseconds, with higher values indicating worse performance.
- CLS: Good at or below a threshold near 0.1, with higher values indicating worse visual stability.
Only the 75th-percentile figure across real user sessions determines your rating. A single fast test in PageSpeed Insights doesn’t override what CrUX recorded from actual visitors over the past 28 days.
Using the 75th percentile instead of an average matters because averages hide bad tails. A page that loads instantly for most people but chokes badly on slow connections or older phones will still get flagged “Poor,” and rightly so, since a quarter of real visits are having a bad time.
Pages with low traffic sometimes don’t accumulate enough CrUX data to get an individual URL-level score. In that case, Google falls back to origin-level or URL-group data, so cleaning up your templates (not just one page) is often the more effective lever.
When reading Search Console’s report:
- Check the status column first: Good, Needs Improvement, or Poor, grouped by similar URLs.
- Filter by device, since mobile and desktop frequently show very different results.
- Click into a URL group to see example pages, then reproduce the issue in a lab tool before touching code.
Why Do Core Web Vitals Matter for SEO and Business Metrics?
Core Web Vitals are a confirmed part of Google’s ranking systems, but they carry far less weight than content relevance and backlinks. Google itself has clarified that page experience signals are only one piece of ranking, and that chasing a perfect score purely for SEO points is unlikely to move you past a competitor with stronger content.
Treat it more like a penalty-avoidance lever than a growth lever: pages stuck in “Poor” are actively working against you, but polishing an already-“Good” page rarely produces a visible ranking bump. The bigger payoff usually shows up in engagement numbers, not rankings directly.
Faster, more stable pages tend to keep visitors around longer and reduce the odds they bounce back to the search results before your content even finishes rendering.
Improving how users experience your site tends to show up first in bounce rate and time on page, then eventually in conversion rate, especially on landing pages and checkout flows where every extra second of load time gives a visitor a reason to leave.
Prioritization matters more than perfectionism here:
- Fix every “Poor” page before touching anything rated “Needs Improvement.”
- Don’t spend engineering hours pushing a “Good” score from 2.1 seconds LCP to 1.8 seconds; that effort rarely shows up in rankings or conversions.
- Revisit low-traffic pages only after your highest-traffic templates are clean.
How Do You Measure Core Web Vitals Correctly?
You need both field data and lab data, and they answer different questions. Field data tells you what real visitors experienced; lab data lets you reproduce and debug a specific problem on demand.
Field data comes from the Chrome UX Report (CrUX), which aggregates anonymized performance data from real Chrome users who opted into usage statistics. Google’s ranking systems use CrUX, not lab scores, which is why chasing a high Lighthouse number without checking CrUX can leave you optimizing the wrong thing entirely. Lab data, by contrast, comes from tools like Lighthouse or PageSpeed Insights’ lab section, which simulate a page load under controlled network and CPU conditions so you can reproduce an issue reliably.
| Tool | Data type | Best used for |
|---|---|---|
| Chrome UX Report (CrUX) | Field | Understanding real-world performance at scale |
| Search Console Core Web Vitals report | Field | Finding failing URL groups across your whole site |
| PageSpeed Insights | Field + Lab | Quick check combining real user data with a lab audit |
| Lighthouse | Lab | Detailed, reproducible audits during development |
| WebPageTest | Lab | Deep tracing, filmstrips, and waterfalls across device/network profiles |
| web-vitals JS library | Field (real-time) | Capturing live metric values directly in your own analytics |
A field-versus-lab checklist worth keeping on hand:
- In field data, look for which URL groups and devices show “Poor” or “Needs Improvement” status.
- In lab data, look for the specific resource, script, or layout shift causing the failure.
- Map every lab finding back to a real CrUX complaint before shipping a fix. Don’t chase a lab-only problem that field data says isn’t affecting real users.
A workable end-to-end workflow: pull failing URL groups from Search Console, capture a detailed trace with WebPageTest or Lighthouse, reproduce the same failure locally or in a dev environment, patch it, verify in staging, then wait for CrUX to confirm the fix in production.
How Do You Fix LCP, CLS, and INP Problems?
Debugging works best as a repeatable loop: pull a field trace, reproduce it in the lab, find the exact bottleneck, patch it, verify, then monitor. Here’s how that plays out for each metric.
1. Fixing LCP (Largest Contentful Paint)
- Identify the LCP element using Chrome DevTools’ Performance panel or the “LCP” callout in PageSpeed Insights.
- Compress and serve the hero image in a modern format like WebP or AVIF, with explicit
widthandheightattributes. - Preload the LCP resource so the browser fetches it earlier in the request chain:
<link rel="preload" as="image" href="hero.webp" fetchpriority="high">
- Reduce server response time (TTFB) through caching, a CDN, or trimming server-side processing on the critical path.
- Inline or defer non-critical CSS so render-blocking stylesheets don’t delay the hero content.
2. Fixing CLS (Cumulative Layout Shift)
- Reserve space for every image, video, and iframe using explicit dimensions or
aspect-ratioin CSS. - Avoid injecting banners, cookie notices, or ads into the DOM after the initial layout unless you’ve already reserved their space.
- Animate with
transformandopacityinstead of properties liketop,left, orheight, since those trigger layout recalculation:
.modal {
  transform: translateY(0);
  transition: transform 0.3s ease;
}
3. Fixing INP (Interaction to Next Paint)
- Break up long JavaScript tasks (anything over 50 milliseconds) into smaller chunks so the main thread can respond to input between them.
- Offload heavy computation to a Web Worker instead of running it on the main thread.
- Use
requestIdleCallbackor a chunkedsetTimeoutpattern to defer non-urgent work:
function chunkTask(items, callback) {
  const chunk = items.splice(0, 50);
  callback(chunk);
  if (items.length) {
    setTimeout(() => chunkTask(items, callback), 0);
  }
}
- Defer third-party scripts (chat widgets, analytics, ad tags) using
asyncordefer, and audit them regularly since they’re a frequent, invisible source of long tasks.
Prioritize mobile fixes first if your mobile CrUX numbers lag desktop, which they almost always do. Target your highest-traffic URL groups, and use 75th-percentile traces rather than your fastest test run to decide what’s actually worth fixing.
Pro Tip: Third-party scripts are the single most common INP killer nobody budgets time for. Audit every tag manager, chat widget, and ad script quarterly, not just when a client complains about a slow site.

What Should a Core Web Vitals QA Checklist Include?
A short checklist baked into your release process catches regressions before they reach real users, which is far cheaper than discovering them in next month’s CrUX data.
- Run Lighthouse CI on every major deploy and compare against a saved baseline, not an arbitrary target score.
- Verify no metric regressed by more than a small margin before merging to production.
- Recheck Search Console’s Core Web Vitals report 4 to 6 weeks after a fix ships, since CrUX rolls on a 28-day window and won’t reflect changes overnight.
- Test on a representative mid-range mobile device, not just your development machine’s fast connection.
- Include Core Web Vitals checks in CI for any deploy that touches layout, images, or third-party scripts.
Pro Tip: A/B testing tools are a sneaky CLS trap. If your testing script swaps content after the initial render, it can tank your layout stability score even though the “real” page never changes for most users. Load test variants before the first paint whenever possible.
What Does a Reliable Monitoring Workflow Look Like?
A one-off fix isn’t the finish line. Core Web Vitals drift over time as content, ads, and third-party scripts change, so monitoring has to be ongoing.
- Detect a problem in Search Console’s Core Web Vitals report, filtered by URL group and device.
- Capture a detailed trace using WebPageTest or Chrome’s own Performance panel.
- Reproduce the failure in a local or staging environment under similar network conditions.
- File a fix ticket with the specific bottleneck identified, not just “page is slow.”
- Deploy to staging and validate with Lighthouse CI before promoting to production.
- Monitor CrUX and Search Console over the following weeks, and set alerts for origin-level drops.
For continuous integration, Lighthouse CI and the PageSpeed Insights API both support automated threshold gating, so a pull request can fail a build automatically if LCP or CLS regresses past a set limit. Scheduled WebPageTest runs against key templates add another layer, catching drift that only shows up under specific network conditions.
Set your expectations around timing: CrUX reflects a rolling 28-day window, so a fix deployed today typically won’t show as “Good” in Search Console for four to six weeks. Track the 75th-percentile trend line rather than checking daily and panicking over noise.
Should You Hire an Agency or Fix Core Web Vitals In-House?
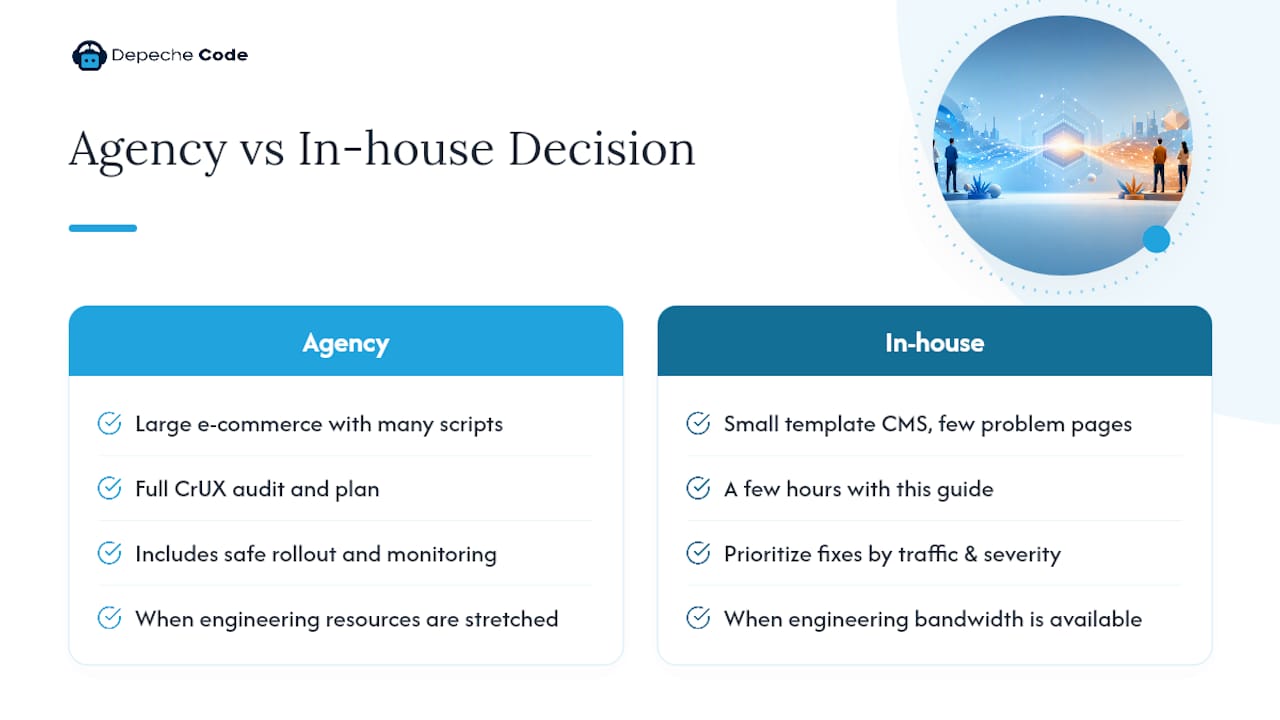
The decision usually comes down to four things: how complex your platform is, how much engineering bandwidth you actually have free, how tightly performance work competes with feature deadlines, and how much traffic is riding on the pages in question.
A small marketing site on a template-based CMS with one or two problem pages is often a reasonable DIY project for a developer with a few hours and this guide open in another tab. A large e-commerce platform with dozens of third-party scripts, a complex checkout flow, and engineering resources already stretched across feature work is a different situation entirely, and that’s usually where bringing in outside help pays for itself.
A solid agency audit should include a full CrUX review across your top URL groups, a prioritized remediation plan (not a generic checklist), a safe rollout plan that avoids breaking existing conversion flows, and an ongoing monitoring dashboard so regressions get caught before they cost rankings or revenue. If you’re evaluating agencies, ask for specifics on all four during the initial call, not just a promise of “we’ll speed up your site.”
Depechecode approaches Core Web Vitals work as part of a broader website development and technical SEO practice: auditing field data first, prioritizing fixes by traffic and severity, and validating every change against real CrUX numbers rather than a one-time lab score.
Pro Tip: In an initial agency call, ask specifically how they measure success after a fix ships. If the answer is “we’ll rerun Lighthouse,” that’s a lab score, not proof the fix worked for real visitors.
What Trade-Offs Come With Chasing Perfect Scores?
The honest answer is that not every page deserves the same level of engineering effort, and treating Core Web Vitals as a uniform mandate across an entire site wastes resources that could go toward content or conversion work instead.
A high-traffic marketing landing page justifies serious investment: preloading assets, trimming third-party scripts, maybe even a dedicated performance sprint. A low-traffic internal admin page or a rarely visited legacy blog post usually doesn’t, even if its score sits in “Poor.” The traffic and business value attached to a page should drive how much engineering time it gets, not just its raw score.
I’ve seen teams burn a full sprint chasing a “Good” LCP score down from 2.6 to 2.1 seconds on a page that gets a handful of visits a month, while a checkout page sat at 4.8 seconds LCP the entire time. That’s a prioritization failure, not a technical one. The fix isn’t more engineering hours; it’s better triage before the sprint starts.
My recommendation: align Core Web Vitals work with your content and conversion priorities from the start, not as an afterthought once a stakeholder notices a red score in Search Console. Fix what’s “Poor” on pages that make money or drive engagement first. Everything else can wait.
How Depechecode Approaches Core Web Vitals Remediation
Depechecode is the alternative to guessing your way through a Core Web Vitals fix. Instead of chasing a lab score in isolation, the process starts with field data, prioritizes the pages actually driving your traffic and revenue, and rolls out changes safely so a performance fix never breaks a conversion flow you depend on.

Services relevant to this kind of work include full website development and redesign with performance built in from the first line of code, ongoing SEO plans that track Core Web Vitals alongside rankings, and hosting and monitoring so a regression gets caught before it costs you a month of CrUX data. If your Search Console report is showing red or yellow across your top pages, request a website audit through Depechecode and get a prioritized plan instead of a generic checklist.
What Resources Should You Bookmark for Core Web Vitals?
- Google Search Central: Core Web Vitals guidance for the official ranking-signal documentation.
- Web for deep dives into each metric and recommended tooling.
- How Core Web Vitals thresholds were defined for the reasoning behind the exact numeric cutoffs.
- Search Console’s Core Web Vitals report for finding failing URL groups on your own site.
- WebPageTest for detailed trace capture, filmstrips, and waterfall views across device and network profiles.
- Search Engine Roundtable’s coverage of Google’s page experience clarifications for context on how much ranking weight Core Web Vitals actually carry.
Check the official Google sources whenever thresholds or methodology questions come up. Use WebPageTest and Lighthouse for hands-on debugging once you know which page and metric need attention.
Sources
- Web
- Understanding Core Web Vitals and Google search results — Google Search Central
- Core Web Vitals report — Search Console Help
- Google clarifies page experience & Core Web Vitals — Search Engine Roundtable
- WebPageTest
FAQ
What Are the Core Web Vitals?
Core Web Vitals are three field metrics, Largest Contentful Paint (LCP), Interaction to Next Paint (INP), and Cumulative Layout Shift (CLS), that measure loading speed, responsiveness, and visual stability using real-user data from the Chrome UX Report.
Are Core Web Vitals Still Relevant for SEO?
Yes. Google confirmed they remain part of its ranking systems, though they carry less weight than content relevance and backlinks, and act more as a penalty-avoidance signal than a ranking booster once a page reaches “Good.”
What Is Considered a Good Core Web Vitals Score?
A “Good” score means LCP at 2.5 seconds or under, INP at 200 milliseconds or under, and CLS at 0.1 or under, each measured at the 75th percentile of real visits.
How Do I Pass a Core Web Vitals Assessment?
Check your field data in Search Console or PageSpeed Insights, fix whichever metric is scored “Poor” on your highest-traffic pages first, then verify the fix in CrUX after the typical 4 to 6 week reporting lag.
Should I Use Lighthouse or Field Data to Judge My Site?
Use both, but trust field data (CrUX) for actual ranking impact since that’s what Google uses; treat Lighthouse and PageSpeed Insights’ lab scores as debugging tools, not the final grade.