

Conversion rate optimization is the practice of turning more of your existing website visitors into customers, subscribers, or leads without spending more on traffic. Your first move is simple: pick your highest-traffic page, pull its current conversion rate from analytics, and write that number down as your baseline. Everything from here is iterative testing built on that starting point.
TL;DR:
- Improving micro conversions, like reducing form fields or clarifying CTAs, can significantly boost outcomes without additional marketing spend.
- Focus tests on high-traffic pages such as landing pages, checkout flows, and mobile experiences, where small changes yield the fastest, most measurable gains.
- Use simple tools like Google Analytics and free heatmap software to identify drop-off points and inform hypotheses before running A/B tests.
- Prioritize tests with high potential and ease using frameworks like PIE, targeting pages that handle the most traffic or revenue for the best return.
Table of Contents
- What Is Conversion Rate Optimization, Exactly?
- Why Does Conversion Rate Optimization Matter for Small Sites?
- How Do You Calculate Conversion Rate and Other Key Metrics?
- What Are the Steps in the Conversion Rate Optimization Process?
- Which Tools Should Beginners Use to Gather CRO Data?
- Where Should You Focus Your First Optimization Efforts?
- How Do You Prioritize Which Tests to Run First?
- What’s the Difference Between A/B Testing and Multivariate Testing?
- What Should a Beginner Do in the First 30 Days?
- What Mistakes Do Most Beginners Make in CRO?
- How Depeche Code Approaches a CRO Audit
- How Do You Combine Qualitative and Quantitative Data?
- How Should Beginners Approach Personalization and Segmentation?
- What Ethical and Privacy Considerations Apply to CRO?
- Setting Realistic Expectations for Your CRO Program
- Want a Faster Path to Higher Conversions?
- Where to Learn More About CRO
- Sources
- FAQ
What Is Conversion Rate Optimization, Exactly?
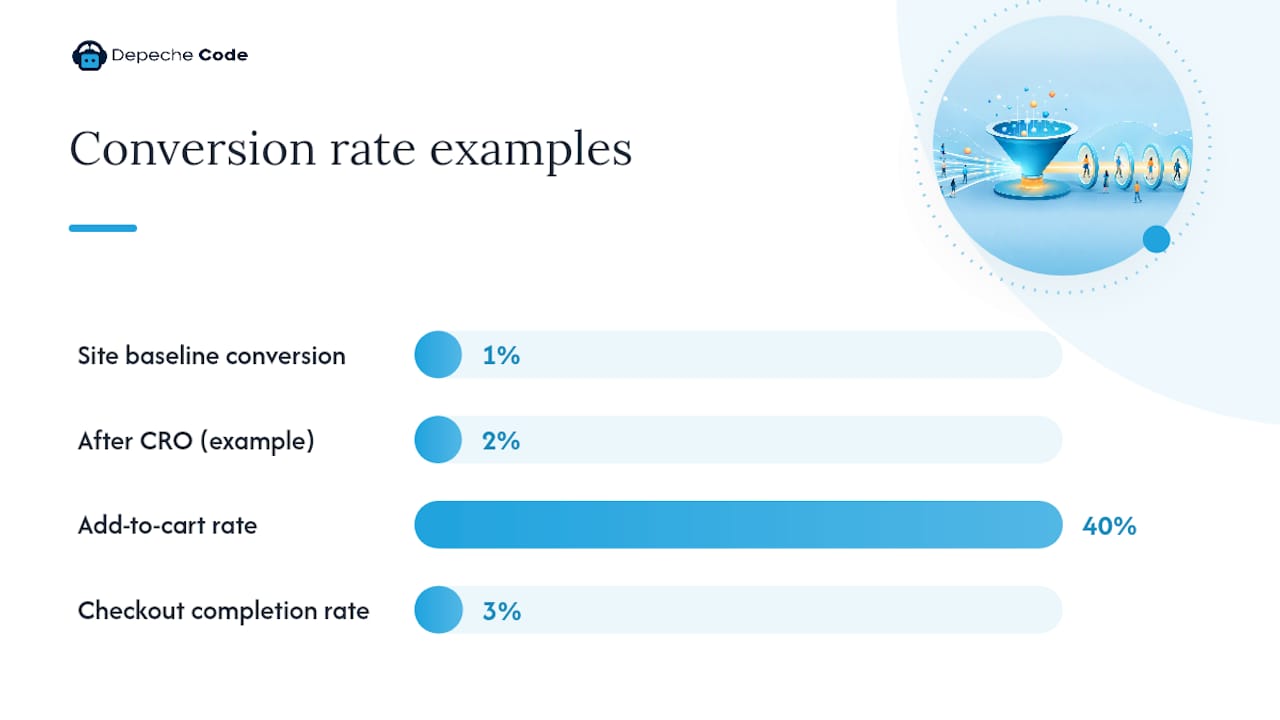
Conversion rate optimization (CRO) is the systematic process of increasing the percentage of website visitors who complete a desired action. That definition matters because it points at behavior, not traffic volume. A site pulling in 50,000 monthly visitors with a 1% conversion rate produces 500 outcomes. Fix the experience so that rate climbs to 2%, and you’ve doubled results without spending another dollar on ads or SEO.
CRO targets two categories of action, and beginners often only think about one of them.
- Macro conversions are the big-ticket outcomes: a completed purchase, a signed contract, a booked demo call.
- Micro conversions are the smaller steps that lead there: adding an item to a cart, starting a signup form, watching a product video, or clicking through to a pricing page.
Tracking only macro conversions leaves you blind to where visitors actually drop off. If 40% of people add a product to their cart but only 3% finish checkout, the story is in that gap, not in the final number alone.
CRO doesn’t replace SEO or paid advertising. It works downstream of both. SEO and ads solve the problem of getting people to your site; CRO solves the problem of what happens once they’re there. A well-optimized site makes every dollar spent on traffic acquisition work harder, because a bigger share of that traffic actually converts. Skipping CRO while pouring money into traffic is a bit like filling a bucket with a hole in the bottom. The HubSpot CRO framework starts exactly here: identify your key conversions before you touch a single design element.
Why Does Conversion Rate Optimization Matter for Small Sites?
A 1 percentage point lift in conversion rate often costs less to achieve than the equivalent lift in traffic. Getting 10% more visitors through SEO or ads usually means months of content work or a bigger ad budget. Getting 10% more conversions from your existing visitors might mean rewriting one headline or removing two form fields.
The math that convinces skeptics: if your site converts at 2% and averages $80 per order, 10,000 monthly visitors generate $16,000. Push that conversion rate to 2.5%, a modest, achievable jump for a site with real friction points, and revenue rises to $20,000 from the exact same traffic. That’s $48,000 a year in new revenue with zero additional ad spend.
CRO gains also compound in ways paid traffic doesn’t. A traffic campaign stops producing the moment you stop paying for it. A fixed checkout flow, a clarified headline, or a shortened form keeps converting at the improved rate indefinitely, for every future visitor.
Consider a few realistic scenarios:
- An e-commerce store removes a mandatory account-creation step from checkout and cart abandonment drops noticeably, recovering sales that were already paid for through advertising.
- A B2B service site adds a single trust badge and a clearer CTA above the fold on its contact page, and demo requests increase without any change in ad spend.
- A SaaS signup flow cuts its form from nine fields to four, and free trial signups rise because fewer people quit halfway through.
None of these examples required new traffic. They required paying attention to what was already happening on the page.
How Do You Calculate Conversion Rate and Other Key Metrics?
The core formula is straightforward: (Conversions ÷ Total Visitors) × 100 = Conversion Rate.
Funnel analysis extends that same formula to each step of a multi-stage process, and it’s usually where the real diagnostic value lives.
That table tells a specific story: the biggest single drop happens between landing page view and add-to-cart, which means that page, not checkout, deserves the first round of attention.
Beyond the headline conversion rate, a few secondary KPIs round out the picture:
- Bounce rate shows how many visitors leave without interacting, often flagging a mismatch between what an ad promised and what the page delivers.
- Average order value (AOV) measures revenue per transaction and matters as much as conversion rate for total revenue.
- Form abandonment rate isolates where in a multi-field form people quit.
- LTV to CAC ratio compares customer lifetime value against acquisition cost, a north-star metric once you’re optimizing beyond a single page.
Per Shopify’s guide on calculating and improving conversion rate, the formula stays constant, but which metric you optimize should shift depending on whether your bottleneck is traffic quality, page clarity, or checkout friction. Pick one primary metric per test. Chasing five KPIs at once is how beginners lose the thread of what actually caused a result.
What Are the Steps in the Conversion Rate Optimization Process?
CRO isn’t a single action. It’s a repeating cycle, and skipping steps is the single most common way beginners waste their first few months. The sequence looks like this:
- Research first, always. Pull your analytics funnels to find where drop-off is steepest. Layer in heatmaps and session recordings to see how people actually behave on that page. Run a short on-site survey asking “what almost stopped you from completing this?” This mix of numbers and observed behavior is what separates a real diagnosis from a guess.
- Write a specific hypothesis. A usable hypothesis follows a template: “If we [change X], then [metric Y] will improve, because [rationale].” For example: “If we move the price above the product description, then add-to-cart rate will improve, because session recordings show 30% of visitors scroll down looking for pricing before leaving.”
- Prioritize before you build anything. Not every hypothesis deserves equal attention. Score each idea using a framework like PIE (Potential, Importance, Ease) or ICE (Impact, Confidence, Ease), and weight pages that sit behind your most expensive paid traffic higher, since fixes there pay back fastest.
- Design the experiment. Decide whether this is a simple two-version A/B test or something that needs multiple variable combinations. Keep the change focused enough that you can attribute any result to a specific cause.
- Run it, then learn from it regardless of outcome. A losing test isn’t a failure. It’s data that rules out a false assumption about your visitors, which is often just as valuable as a win.
Pro Tip: Keep a shared document logging every hypothesis, every test result, and every “why” behind it, win or lose. Six months in, that log becomes the single most valuable asset in your CRO program because it stops your team from re-testing ideas you already disproved.
The loop closes when you take what you learned and feed it into the next round of research. CRO teams that treat this as one big cycle, rather than a series of disconnected tweaks, are the ones who see compounding results after a year.
Which Tools Should Beginners Use to Gather CRO Data?
You don’t need an expensive toolkit to start. Four categories of tools cover almost everything a beginner needs, and most have free or low-cost entry points.
- Analytics platforms like GA4 track funnels, events, and drop-off points, and they’re the foundation for spotting where visitors disengage.
- Behavioral tools such as Microsoft Clarity provide heatmaps and session recordings at no cost, showing exactly where people click, how far they scroll, and where their cursor hesitates.
- On-site feedback tools, including simple exit-intent surveys, ask visitors directly why they’re leaving instead of forcing you to guess from behavioral data alone.
- Experiment platforms range from built-in A/B testing inside many website builders to dedicated testing software once traffic volume justifies the investment.
Heatmaps and recordings deserve special attention because they catch problems funnels miss entirely. Clarity’s own data on user behavior shows visitors frequently click on elements that aren’t actually clickable, images they assume link somewhere, text they expect to expand. That’s a direct signal of a missing link or unclear affordance, and it’s invisible in a standard analytics funnel report. If you only look at conversion numbers, you’ll never see the visitor rage-clicking a static image trying to get more product details.
Start with whatever tool is already built into your website platform or analytics stack before paying for anything new. Most beginners have more usable data sitting unexamined in GA4 and a free heatmap tool than they realize.
Where Should You Focus Your First Optimization Efforts?
Not every page deserves equal attention early on. Four areas consistently produce the fastest, most measurable returns for beginners.
- Landing pages benefit from the “rule of one”: one offer, one call to action, no navigation menu pulling visitors away before they convert. A cluttered header with six navigation links gives a visitor six ways to leave before completing the one action you actually want.
- Pricing and checkout convert better when price appears after the value proposition is established, not before. Offering guest checkout instead of forcing account creation, and adding risk-reversal language like a clear return policy, both reduce last-minute hesitation.
- Forms should ask for the minimum information needed to move forward. A single-column layout outperforms multi-column forms because it removes visual decision points, and progressive profiling, collecting minimal data up front and more after conversion, keeps initial friction low while still gathering what you need over time.
- Mobile experience deserves its own audit pass. CTA buttons need to sit within easy thumb reach, tap targets need enough spacing to avoid mis-taps, and page load speed on mobile connections can make or break whether a visitor sticks around long enough to see your offer.
Conversion benchmarks vary sharply by industry and device, according to Statista’s segmented conversion-rate data. That’s a strong argument against chasing a generic “average conversion rate” figure. A 2% rate might be excellent for a considered B2B purchase and mediocre for a low-price impulse buy. Set your own baseline and measure improvement against it, not against an industry-wide number that may not describe your traffic at all.
How Do You Prioritize Which Tests to Run First?
The PIE framework scores every hypothesis on three factors: Potential (how much room for improvement exists), Importance (how much traffic or revenue the page handles), and Ease (how much effort the change requires). Score each factor 1 to 10, average the three, and rank your list.
A worked example makes this concrete. Say you’re weighing two ideas: rewriting your homepage hero copy versus adding a trust badge to a low-traffic support page. The homepage hero might score high on Potential (visitors clearly bounce fast) and Importance (it’s your top-traffic page) but moderate on Ease (copywriting takes iteration). The support page trust badge scores low on Importance simply because so few people see that page. The homepage wins the priority slot even though the badge is technically easier to ship.
- Pages sitting behind your most expensive paid keywords deserve priority regardless of PIE score, because every visitor there already cost you money to acquire.
- High-value flows, checkout, signup, demo requests, should generally outrank low-value pages like a blog post’s newsletter signup.
- Balance your test calendar between quick wins (a headline swap, a button color, a form field removed) and bigger structural tests (a full page redesign, a new checkout flow), so you’re shipping improvements continuously instead of waiting months for one big test to finish.
Quick wins keep momentum and stakeholder buy-in alive while bigger tests run in the background.
What’s the Difference Between A/B Testing and Multivariate Testing?
A/B testing compares two full versions of a page against each other and tells you which one performs better as a whole. Multivariate testing changes multiple elements at once and measures which combination performs best, but it needs considerably more traffic to reach a reliable answer because it’s testing more variables simultaneously.
For most beginner sites, A/B testing is the right starting point. Multivariate testing only makes sense once you have enough consistent traffic to split across several variable combinations without waiting months for results.
Sample size and duration matter more than most beginners expect. Ending a test after three days because one version is “clearly winning” is one of the fastest ways to act on noise instead of a real signal. Run tests long enough to capture a full weekly cycle of traffic, since weekday and weekend visitor behavior often differs, and don’t call a winner until you’ve reached a sample size that gives you statistical confidence rather than a lucky streak.
- If your site gets low traffic, a classic A/B test may never reach significance in a reasonable timeframe. In that case, lean on directional and qualitative methods instead, like structured user interviews and larger, more obvious changes to your offer or headline, rather than testing tiny variations that need huge sample sizes to detect.
- Treat an inconclusive or losing test as information, not wasted effort. Knowing that a bold CTA color doesn’t move the needle for your audience saves you from revisiting that idea six months from now.
Pro Tip: Before launching any test, decide in writing what “success” looks like and how long the test will run. Deciding those two things after you’ve already seen partial results is how confirmation bias creeps into your conclusions.
What Should a Beginner Do in the First 30 Days?
A focused first month beats an ambitious, unfocused one. Here’s a week-by-week plan built for someone starting from zero.
- Week 1: Audit and baseline. Pull your current conversion rate for your one or two highest-traffic pages. Install a heatmap tool if you don’t have one. Write down your starting numbers so future progress has something to compare against.
- Week 2: Research and hypothesize. Watch a handful of session recordings on your chosen pages. Run a short exit survey. Write two or three specific, testable hypotheses using the “if we change X, then Y will improve because Z” format.
- Week 3: Launch your first tests. Pick the highest-priority hypothesis, likely something involving a headline, CTA wording, or a form field, and launch an A/B test. Let it run without touching it, and check daily only to confirm tracking is working correctly, not to call a premature winner.
- Week 4: Analyze, document, and roll out. Once you’ve reached a reasonable sample size, review the results. Roll out the winning version site-wide, document what you learned in your test log, and pick your next hypothesis to carry into month two.
This cadence keeps the cycle moving without overwhelming a solo marketer or small team, and it produces a documented result within 30 days rather than an open-ended project with no clear finish line.
What Mistakes Do Most Beginners Make in CRO?
The single most common mistake is testing before diagnosing. Changing a button color because a blog post recommended it, without first checking whether your actual problem is a confusing headline or a slow-loading page, wastes weeks chasing a fix that was never going to matter.
- Testing without diagnosis means guessing at solutions before you’ve confirmed what the actual problem is, usually because no one looked at analytics funnels or session recordings first.
- Chasing tiny UI tweaks (button colors, font sizes) before fixing bigger issues like unclear value propositions or slow page speed almost always underdelivers, since practitioner guidance consistently points to headline clarity and page speed as higher-leverage fixes than cosmetic changes.
- Ignoring mobile traffic or failing to segment by source means you might “fix” a page for desktop visitors while mobile users, often the majority of traffic, see no improvement at all.
- Not documenting tests and outcomes means your team repeats failed experiments a year later because nobody remembers, or wrote down, that it was already tried.
Fixing fundamentals first isn’t the exciting part of CRO. It’s the part that actually moves the number.
How Depeche Code Approaches a CRO Audit
When Depeche Code runs a CRO audit for a client, the process mirrors what’s outlined above, just executed with more tooling and cross-industry pattern recognition than a solo beginner typically has time to build. An audit generally surfaces the same handful of issues across different client sites.
- Unclear above-the-fold messaging that makes a visitor guess what the business actually offers.
- Checkout or form friction, often too many required fields or a missing guest checkout option.
- Page speed problems on mobile that quietly kill conversions before a visitor even sees the offer.
Deciding between doing this yourself and bringing in outside help usually comes down to time and traffic volume. If your site gets modest traffic and you have a few hours a week, the DIY path in this guide will get you real results. If you’re managing multiple pages, running paid campaigns, or need faster redesign work than your schedule allows, a managed audit compresses months of trial and error into a prioritized roadmap.
How Do You Combine Qualitative and Quantitative Data?
Numbers tell you what is happening. Behavior and feedback tell you why. Relying on only one type of data leaves half the picture missing, and it’s the reason so many CRO efforts stall after the obvious fixes run out.
Quantitative data, funnel drop-off rates, bounce rates, conversion percentages, tells you precisely where visitors leave. That’s where qualitative sources come in: a session recording might show visitors repeatedly backing out to check whether shipping is free, or an exit survey might reveal that people expected to see a total price earlier in the flow.
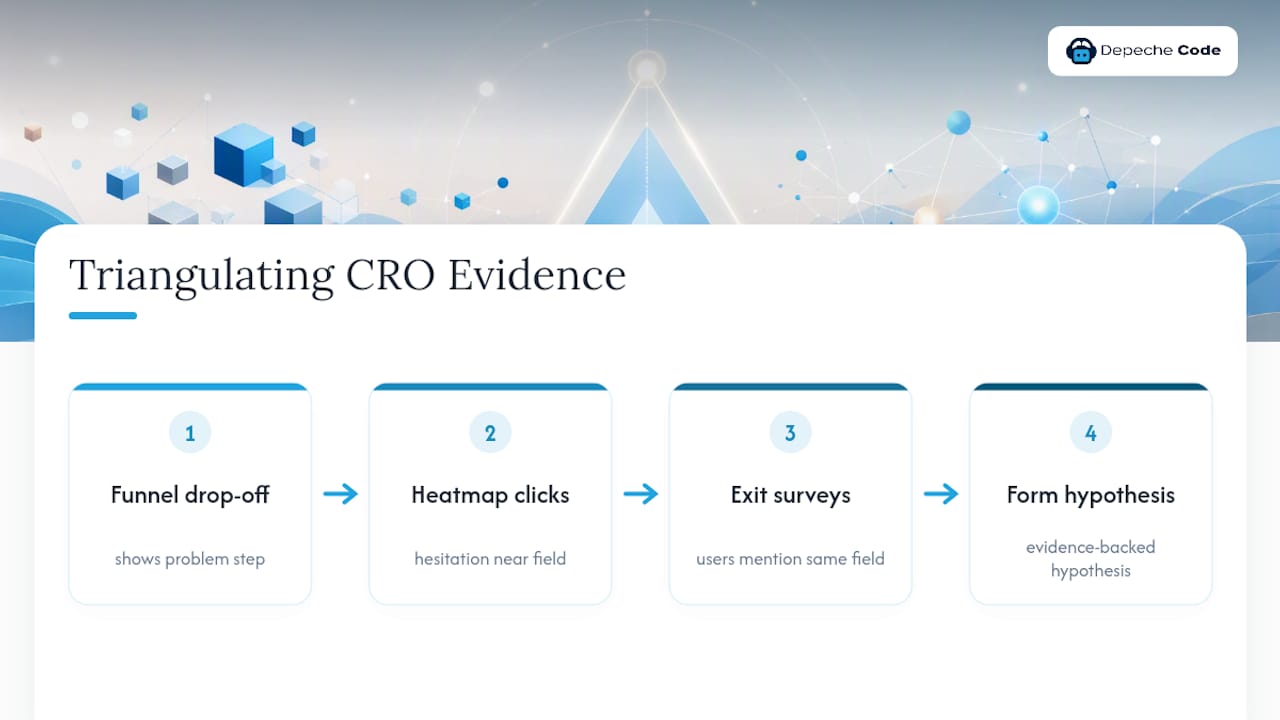
The most reliable hypotheses come from triangulating both. If your funnel shows a drop at step three, and your heatmap shows hesitation clicks near a specific field, and three exit-survey responses mention confusion about that same field, you’ve got a hypothesis backed by three independent data sources rather than a hunch. That’s a fundamentally stronger starting point than a hypothesis based on analytics alone or a single anecdotal comment from a colleague.
A practical habit: whenever a funnel report flags a problem area, immediately pull three to five session recordings from visitors who dropped off at that exact step before writing your hypothesis. That five-minute habit routinely surfaces the actual cause faster than staring at a spreadsheet.
How Should Beginners Approach Personalization and Segmentation?
Personalization in CRO doesn’t have to mean building complex dynamic content systems from day one. Basic segmentation, splitting results and even experiences by traffic source, device type, or new versus returning visitor, delivers most of the value beginners need.
Start by segmenting your analytics reports before you segment your actual page content. Compare conversion rates for mobile versus desktop, or for visitors arriving from paid search versus organic search. These groups frequently behave differently enough that a single page optimized for “the average visitor” underperforms for both.
Once you understand those differences, simple personalization tactics can follow: showing a different headline to returning visitors than first-time ones, adjusting a call to action based on whether someone arrived from a specific ad campaign, or tailoring a landing page’s opening message to match the search intent that brought someone there. None of this requires enterprise software. Many website platforms and email tools now include basic segmentation and dynamic content features built in.
The mistake to avoid is over-segmenting before you have enough traffic to support it. Splitting a moderate-traffic page into six different personalized variants means each variant gets a fraction of the data needed to draw a reliable conclusion. Start with one or two meaningful splits, mobile versus desktop is usually the highest-value place to begin, and add complexity only once you have the traffic volume to support it statistically.
What Ethical and Privacy Considerations Apply to CRO?
CRO involves collecting visitor behavior data, which means privacy compliance isn’t optional, it’s part of running the program correctly. Heatmap tools, session recordings, and analytics platforms all capture some form of user behavior, and that data collection needs to be disclosed and handled responsibly.
Make sure your site’s privacy policy and cookie consent mechanisms cover the specific tools you’re using for behavioral tracking. Session recording tools in particular should be configured to mask sensitive fields like passwords, payment details, and personal identification numbers automatically, most reputable tools do this by default, but it’s worth confirming rather than assuming.
There’s also an ethical line inside the optimization tactics themselves. Techniques sometimes called “dark patterns”, hidden fees revealed only at the final checkout step, deceptive urgency countdowns that reset, or checkboxes pre-selected to opt visitors into something they didn’t request, might lift short-term conversion numbers, but they erode trust and increase refund requests and complaints over time. A sustainable CRO practice optimizes for genuine clarity and reduced friction, not for tricking visitors into a click they’ll regret.
Treat every test involving personal data or behavioral tracking as something that needs the same transparency you’d want applied to your own information. That standard tends to keep both your compliance posture and your customer relationships intact for the long run.
Setting Realistic Expectations for Your CRO Program
CRO rewards patience more than any other part of digital marketing, and that’s the part beginners underestimate most. A single test rarely transforms a business. What compounds into real results is a dozen small, validated wins stacked over a year: a clearer headline here, a shorter form there, a checkout flow with one less required field.
Document everything, even the tests that fail. A losing test that rules out a false assumption is progress, not wasted time, and six months from now that log will save you from re-testing an idea you already know doesn’t work.
Focus your limited time on the pages carrying the most traffic or the most revenue first. A perfectly optimized page that gets 50 visitors a month will never outperform a modestly improved page that gets 50,000. Prioritize based on where your visitors actually are, not on which page is most fun to redesign.
— Donovan Wells – Founder and CEO
Want a Faster Path to Higher Conversions?
Running CRO yourself works, but it takes consistent hours every week: pulling reports, watching recordings, writing hypotheses, building tests, and waiting for results. For business owners already stretched across sales, operations, and everything else, that time is often the real bottleneck, not the lack of ideas.
A managed CRO engagement typically starts with a full audit of your highest-traffic pages, followed by a prioritized roadmap ranking each fix by potential impact and effort. From there, the team builds and runs the actual tests, tracks results against clear KPIs, and reports back on what changed and why. That structure suits business owners who know their website should be converting better but don’t have the bandwidth to run the research-hypothesis-test cycle themselves month after month.
If you’d rather have a team handle the audit, the testing, and the reporting while you run the rest of your business, visit the Depeche Code services page to see how a managed engagement works and request a starting audit for your site.
Where to Learn More About CRO
For deeper reading beyond this primer, HubSpot’s CRO guide walks through the identify-analyze-test framework in more detail. Shopify’s conversion rate breakdown covers calculation formulas and page-specific tactics. For free behavioral data, Microsoft Clarity offers heatmaps and recordings with no cost barrier to entry. Statista’s industry benchmark data helps you understand where your numbers stand relative to your sector. For additional beginner-friendly tactics, Baby Love Growth’s CRO tips round out the practical side of this guide.
Sources
- Global conversion rate by industry and device (Statista)
- Microsoft Clarity
- How to improve your conversion rate (Shopify)
FAQ
What Is the Basic Idea Behind Conversion Rate Optimization?
CRO is the process of increasing the percentage of website visitors who complete a desired action, like a purchase or signup, without needing more traffic. It works by diagnosing friction points through analytics and behavioral data, then testing specific changes to remove that friction.
What Are the Main Steps in the Conversion Process?
The core CRO cycle runs through four stages: research to find where visitors drop off, forming a hypothesis about why, prioritizing which fix to test first, and running the experiment to measure the result. This mirrors the HubSpot CRO framework of identifying conversions, analyzing funnels, gathering data, and testing.
How Do You Actually Optimize a Website’s Conversion Rate?
Start by calculating your current conversion rate using (conversions ÷ visitors) × 100, then use analytics and heatmaps to find where visitors struggle most. Focus first on high-impact areas like landing pages, pricing, and checkout, since Shopify’s optimization guide points to these as the pages with the fastest measurable returns.
What Tools Do I Need to Get Started With CRO?
You need an analytics platform for funnel tracking, a heatmap or session-recording tool for behavioral insight, and a way to run A/B tests, many website platforms include this feature natively. Microsoft Clarity is a free option that covers heatmaps and recordings for beginners with no budget.
Should I Try CRO Myself or Hire an Agency?
If you have a few hours a week and modest traffic, the DIY approach in this guide can produce real results within a month. If you’re managing multiple campaigns or need faster turnaround, a managed audit and roadmap from an agency compresses months of trial and error into a prioritized plan.