

The single best approach to WordPress performance monitoring combines always-on uptime and real-user monitoring with scheduled synthetic lab tests and targeted diagnostic profiling when something breaks. Turn on uptime checks today, install a lightweight real-user monitoring plugin, and run a PageSpeed Insights baseline on your top five pages before you do anything else. If you’d rather skip the setup entirely, an agency-managed monitoring plan covers the same ground hands-off.
TL;DR:
- Monitoring should focus on uptime, core web vitals, TTFB, error logs, slow database queries, third-party API latency, and SSL expiration, with specific thresholds for alerts.
- Use separate tools: lightweight plugins for continuous trend monitoring, synthetic tests like PageSpeed Insights and DebugBear for scheduled reviews, and diagnostics plugins like Query Monitor for detailed troubleshooting.
- Set up a routine that includes baseline tests, regular replay of synthetic audits, real-user monitoring, and active incident triage, with alerts checked in context to avoid false positives.
- Check performance weekly with uptime and error scans, conduct monthly plugin and server audits, and schedule quarterly in-depth reviews to prevent drift and ensure optimization.
- Managed monitoring plans by agencies offer a hands-off solution that covers setup, alerting, incident response, and regular reporting, which is ideal for sites with high traffic or limited technical resources.
Table of Contents
- What Metrics Should You Actually Monitor?
- Which Tools And Plugins Cover Each Monitoring Role
- How Do You Set Up Monitoring Step By Step?
- Reading Alerts Without Chasing False Positives
- How Often Should You Check WordPress Performance?
- Agency Perspective: When DIY Monitoring Is Enough
- How Depeche Code Handles Performance Monitoring For You
- Sources
- FAQ
What Metrics Should You Actually Monitor?
Random dashboards full of numbers do nothing for you. Effective WordPress performance monitoring starts with a short list of metrics that actually predict user frustration or revenue loss, each paired with a threshold that tells you when to worry.
Here’s the checklist worth building around:
- Uptime and HTTP response codes: any 5xx spike or downtime event needs immediate alerting, not a weekly review.
- Core Web Vitals: Largest Contentful Paint (LCP), Interaction to Next Paint (INP), and Cumulative Layout Shift (CLS) are Google’s ranking-tied signals, plus First Contentful Paint (FCP) for perceived speed.
- Time to First Byte (TTFB): the first sign your server or database is struggling before any front-end code even runs.
- Error rates and PHP error logs: fatal errors, deprecated function warnings, and REST/AJAX failures that break functionality silently.
- Slow database queries: anything crossing 50 to 100 milliseconds per query on a busy page deserves a second look.
- Third-party API latency: payment gateways, shipping calculators, and ad scripts that stall your page while waiting on someone else’s server.
- SSL certificate expiry: a boring metric until it takes your entire site offline overnight.
Pro Tip: Treat LCP above 2.5 seconds and TTFB above 600 milliseconds as your starting alert thresholds, then tighten them once you know your site’s normal range.
Not every page needs the same scrutiny. Homepages and landing pages live and die on LCP and CLS because that’s what visitors see first. Checkout and product pages need TTFB and third-party API latency watched closely, since a slow payment gateway call can quietly tank conversions with no visible error message. WordPress’s own performance optimization documentation recommends pairing browser devtools with server-side tuning, which is exactly the split this checklist follows.
Which Tools And Plugins Cover Each Monitoring Role
No single plugin does all of this well, and trying to force one to is how sites end up with monitoring overhead heavier than the problem it’s tracking. Split the job by role instead.
- Synthetic lab testing — Run PageSpeed Insights for a free baseline snapshot, then step up to DebugBear for scheduled regression checks that catch a slowdown the week it happens instead of the month you finally notice traffic dropping. DebugBear also blends lab data with real-world CrUX field data, so you’re not chasing a number that never matches what visitors experience.
- Real user monitoring (RUM) — Vibes captures Web Vitals from actual visitor sessions and lets you segment by device and user type, which matters because a lab test on a fast desktop connection tells you almost nothing about your mobile checkout experience.
- Plugin and theme diagnostics — Query Monitor is the standard for attributing slow database queries, PHP errors, and enqueued scripts to the exact plugin or theme responsible, rather than leaving you to guess. Track Debug centralizes server and application diagnostics, including REST and AJAX failures, into one dashboard if you’d rather not juggle several tools. Scrutoscope and F12 Profiler go a step further, attributing server request time down to the specific hook or function eating CPU cycles.
- Uptime and alerting — a dedicated uptime service or cron-based check pinging your site every few minutes, feeding alerts into email or Slack.
- Log aggregation — centralizing PHP error logs and server logs so a spike doesn’t get buried in noise you never read.
Some of these tools carry real overhead. Query Monitor’s deeper features, like full stack traces and SAVEQUERIES logging, add measurable load and should stay off in production, switched on only during an active diagnostic session. Scrutoscope’s sample-based profiling gets around this by running at a low sampling rate in the background, then letting you dial up to full trace mode only when you’re actively hunting a regression.
The practical combination: keep one lightweight always-on plugin running for trend detection, and reserve the heavier profilers for scheduled deep dives or active incidents.
How Do You Set Up Monitoring Step By Step?
Getting from zero to a working monitoring setup takes about an hour of focused work, not a development sprint.
Baseline first:
- Run PageSpeed Insights on your homepage, your highest-traffic landing page, and your checkout or contact page. Record LCP, TTFB, and CLS for each.
- Note your current page weight and active plugin count. Page weight under 1.5MB and fewer than 15 active plugins are reasonable starting budgets to work against.
Install and configure:
- Add a RUM plugin like Vibes, set sampling to avoid overloading your database on high-traffic sites, and restrict its dashboard to admin users only.
- Install a diagnostics plugin, Query Monitor for query and error attribution, or Track Debug if you want one dashboard covering more ground.
- Set up an uptime checker pinging your site every 1 to 5 minutes with email or Slack alerts on failure.
- Schedule a weekly DebugBear regression check against your top three to five pages.
Build your triage workflow:
- Reproduce the issue on staging if possible, not live production.
- Enable deeper profiling (Query Monitor’s full mode, Scrutoscope’s higher sampling) only for the duration of the investigation.
- Attribute the cause to a specific plugin, theme, query, or third-party call.
- Act: apply a hotfix, roll back a recent plugin update, or add a temporary caching rule.
- Verify the fix shows up in both your RUM data and a fresh synthetic test before closing the incident.
Reading Alerts Without Chasing False Positives
An alert without context is just noise. Before reacting, check the timestamp, the sample size behind it, and which specific endpoints or pages triggered it. A single slow page load from one visitor on a bad connection is not a regression; a sustained LCP increase across hundreds of sessions is.
Once you trust the signal, map it to a likely cause:
- High TTFB across most pages usually points to your database or hosting resources, not your theme.
- A spike in POST request errors often traces back to a third-party API, a payment gateway or shipping plugin timing out.
- Rising LCP with stable TTFB typically means render-blocking CSS or JavaScript, or an unoptimized hero image.
- Growing CLS almost always comes from ads, embeds, or fonts loading without reserved space.
Prioritize fixes by impact versus effort. A CDN cache purge or plugin rollback takes minutes and often resolves the immediate pain; a full database cleanup or hosting upgrade takes longer but prevents recurrence. Escalate to your hosting provider when server resource limits (CPU, memory, disk I/O) are the bottleneck, and escalate to a specialist agency when the fix requires code-level changes you’re not equipped to make safely.
How Often Should You Check WordPress Performance?
Monitoring only works if it’s sustainable, and a cadence of weekly glances, monthly audits, and quarterly deep work keeps performance stable without eating your entire week.
- Weekly: check the uptime dashboard, scan for PHP error spikes, glance at Core Web Vitals on your top pages.
- Monthly: audit active plugins, check your autoloaded options table size, verify cache headers and CDN configuration are still correct, and run a full synthetic audit.
- Quarterly: deactivate plugins one at a time to measure their real performance cost, clean up the database, and review whether your hosting resource usage still matches your traffic.
Pro Tip: Keep a simple changelog of every performance-related change, plugin update, hosting migration, cache rule, so a future regression takes minutes to trace instead of hours.
Agency Perspective: When DIY Monitoring Is Enough
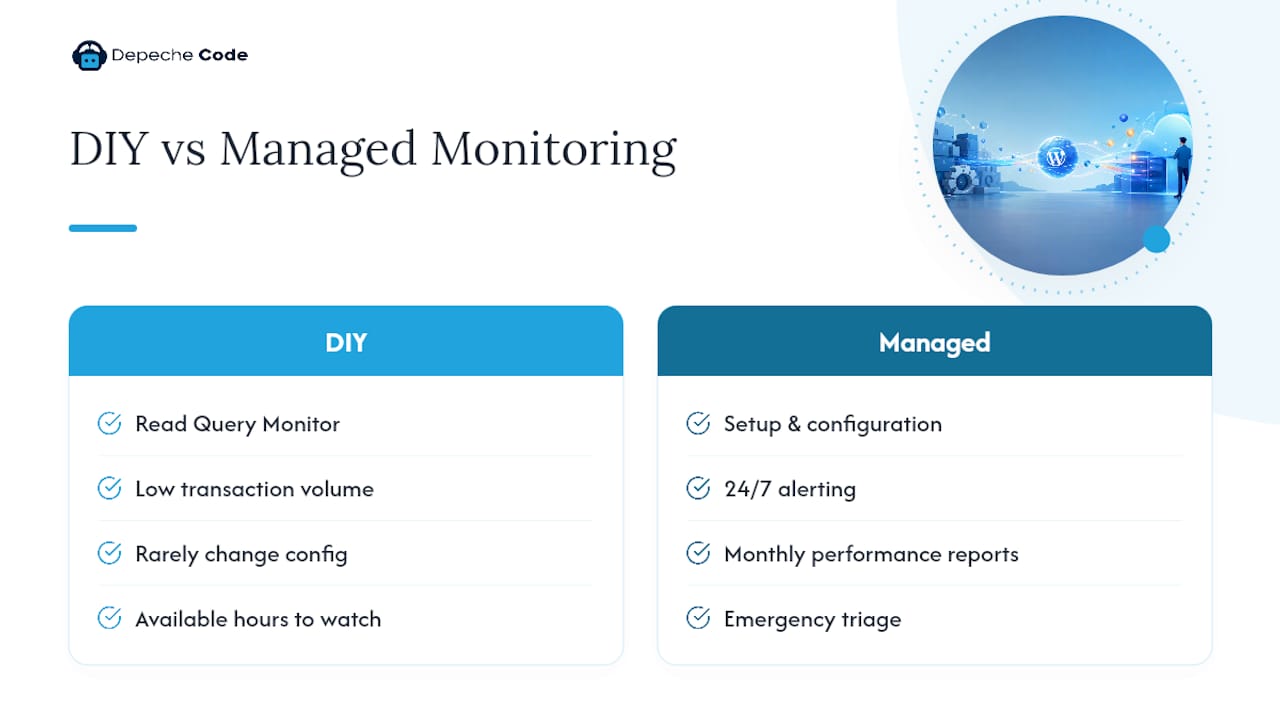
DIY monitoring works fine if you have someone comfortable reading Query Monitor output, your transaction volume is low, and you rarely push configuration changes. It stops working the moment you’re running e-commerce checkout flows, pushing weekly updates, or you simply don’t have the hours to babysit a dashboard.
A managed plan typically covers monitoring setup, 24/7 alerting, monthly performance reports, emergency triage when something breaks, and recurring audits that catch drift before it becomes downtime. The honest test: if a performance incident at 2 a.m. would cost you real revenue and nobody’s watching, DIY monitoring isn’t the gap, staffing is.
— Donovan Wells – Founder and CEO
How Depeche Code Handles Performance Monitoring For You
If you’ve read this far and realized you’d rather not be the one staring at Query Monitor output at midnight, that’s the exact gap Depeche Code’s WordPress maintenance plans are built to close. Instead of stitching together five tools and hoping the alerts reach the right person, you get a managed setup that handles the monitoring stack, the alert triage, and the follow-up fixes as one service.

A typical engagement starts with a performance audit of your current setup, benchmarking Core Web Vitals and server response times against the optimization roadmap that actually moves those numbers. From there, Depeche Code configures monitoring and alerting, sends monthly reports so you’re never guessing where your site stands, and handles incident response when something needs a fast fix rather than a support ticket sitting unread. If your site runs on WordPress and you want someone else carrying the pager, request a performance audit and see what a managed monitoring plan would look like for your specific setup.
Sources
For direct references: WordPress performance optimization docs, Query Monitor, Vibes, and a broader KPI measurement guide for teams tracking success beyond speed alone.
- WordPress Developer: performance optimization
- DebugBear WordPress speed test
- Vibes plugin page
- How to Speed Up Your WordPress Site (2026 Guide) | PageSpeed Matters
FAQ
Why Are Some Site Owners Moving Away From WordPress?
Most who leave cite plugin bloat and performance drift they never monitored closely enough to catch early, not a flaw on WordPress itself. Sites with disciplined monitoring, uptime checks, RUM, and regular plugin audits, rarely hit the breaking point that pushes owners to switch platforms.
How Do I Track User Activity On WordPress?
Real user monitoring plugins like Vibes capture Web Vitals and navigation data from actual visitor sessions, segmented by device and user type. Pair that with your analytics platform for a fuller picture of behavior alongside performance.
What’s A Reasonable LCP Threshold To Alert On?
Start with 2.5 seconds as your LCP alert threshold and 600 milliseconds for TTFB, then adjust based on your own site’s historical baseline once you have a few weeks of data.
Can One Plugin Handle All My Monitoring Needs?
No single plugin covers uptime, RUM, and plugin-level diagnostics equally well, which is why combining a lightweight always-on tool with periodic deeper profiling works better than relying on one all-in-one solution.
How Often Should I Run A Full Performance Audit?
Run a full synthetic audit monthly and a deeper plugin-by-plugin performance review quarterly, with quick uptime and error checks happening weekly in between.