

Fix your hosting and TTFB first. That single change fixes the ceiling every other optimization runs into, and only after it should you touch Largest Contentful Paint, image weight, and caching. Skip that order and you’ll spend a weekend minifying CSS on a server that was never going to load fast anyway.
The stakes are concrete. A one-second delay in page load time cuts conversion rates by roughly 7%, which means speed work pays for itself in most e-commerce and lead-gen sites within weeks. Your targets, per Google’s Core Web Vitals:
- LCP (Largest Contentful Paint): under 2.5 seconds
- INP (Interaction to Next Paint): under 200 milliseconds
- CLS (Cumulative Layout Shift): under 0.1
- TTFB (Time to First Byte): under 200 milliseconds, the foundation everything else builds on
Key Takeaways
Fixing hosting and TTFB first unlocks every other speed gain; image optimization, caching, and script management deliver the next largest wins in that order.
| Point | Details |
|---|---|
| Fix hosting before anything else | TTFB under 200ms sets the ceiling for every other optimization you attempt. |
| Chase Core Web Vitals, not vanity scores | Target LCP under 2.5s, INP under 200ms, and CLS under 0.1 for real user impact. |
| Images are the biggest payload | Converting to WebP/AVIF and resizing cuts 50 to 70% of typical page weight. |
| Delay third-party scripts | Chat widgets and analytics tags are common causes of poor INP scores. |
| Test one change at a time | Stage changes, measure under identical conditions, and keep a rollback plan. |
| Depeche Code handles server-level fixes | Hosting migrations and WordPress performance audits address root causes agencies specialize in. |
Table of Contents
- Website Speed Optimization Priorities: What to Fix First
- How to Measure Website Load Time Correctly
- Why Server and Hosting Choices Set Your Speed Floor
- Front-End Fixes: Images, Code, and Fonts
- Caching Layers and CDN Delivery Explained
- A Safe Workflow for Testing Speed Changes
- When to Hire an Agency vs. Fix It Yourself
- Database Optimization Techniques for Dynamic Websites
- Reducing Third-Party Scripts’ Impact on Load Time
- The Impact of Redirects and How to Minimize Them
- Editorial Take: Why Speed Work Gets Prioritized Backward
- Get Your Site’s Speed Fixed by People Who Do This Daily
- Sources
- FAQ
Website Speed Optimization Priorities: What to Fix First
Not every fix delivers equal return. Some take five minutes and move the needle hard; others eat a full day and barely register. Rank by impact divided by effort, not by what feels satisfying to check off.
- Hosting and TTFB — biggest impact, moderate effort (migrating hosts or upgrading a plan usually takes 1 to 3 hours of setup, more with DNS propagation)
- Preload the LCP element — high impact, 15 minutes of code
- Convert and resize images to WebP/AVIF — high impact, 1 to 4 hours depending on library size
- Enable page and object caching — high impact, 30 minutes if using a managed host’s built-in tools
- Defer non-critical JavaScript — medium to high impact, 1 to 2 hours, test carefully
- Inline critical CSS — medium impact, 1 to 3 hours, higher risk of visual bugs
- Font subsetting and preloading — medium impact, under an hour
- Enable CDN and HTTP/3 — medium impact, 30 minutes to 1 hour if your host or Cloudflare-style provider already supports it
| Fix | Est. time | Impact | Safe on live site? |
|---|---|---|---|
| Hosting/TTFB upgrade | 1–3 hrs | High | Test on staging first |
| Preload LCP image | 15 min | High | Yes |
| Image conversion (WebP/AVIF) | 1–4 hrs | High | Yes |
| Page/object caching | 30 min | High | Yes, but clear cache after |
| Defer JavaScript | 1–2 hrs | Medium/High | Test on staging first |
| Critical CSS inline | 1–3 hrs | Medium | Test on staging first |
| Font subsetting | <1 hr | Medium | Yes |
| CDN/HTTP/3 | 30–60 min | Medium | Yes |
A common quick-win sequence — PHP upgrade, Redis object cache, LCP preload, hero image conversion, and deferred third-party scripts — often moves a site from the 40 to 60 PageSpeed range up into the 80s or 90s.
How to Measure Website Load Time Correctly
You can’t fix what you haven’t measured under consistent conditions. Lab tools like Lighthouse and PageSpeed Insights simulate a load on a fixed connection and device profile, useful for catching regressions before they hit real users. Field data, pulled from the Chrome User Experience Report (CrUX), reflects what actual visitors on actual networks experienced last month.
Both matter, and combining lab and field data gives a fuller picture than either alone: lab tools tell you why something is slow, field data tells you whether real users are actually affected.
Test the same handful of pages every time: your homepage, your highest-traffic landing page, and a typical product or article page. Keep device emulation, geographic test location, and cache state (cold vs. warm) identical between runs, or your before/after numbers won’t mean anything.
Track five numbers on every test:
- LCP, INP, and CLS (the Core Web Vitals)
- TTFB, isolated from total load time
- Total page weight and request count, since both correlate directly with load time
GTmetrix and Pingdom add waterfall charts that show exactly which request is stalling the page, which PageSpeed Insights doesn’t surface as clearly.
Why Server and Hosting Choices Set Your Speed Floor
No amount of front-end polish fixes a slow server. TTFB above 600ms usually means the bottleneck lives in your hosting stack, not your code, and hosting configuration sets the ceiling on what’s achievable no matter how much CSS you trim.
Concrete upgrades that move TTFB the most:
- PHP 8.2 or newer with OPcache enabled, which alone can cut PHP execution time significantly on database-heavy sites
- NVMe or SSD storage instead of spinning disks, standard on most managed hosts now but still absent on cheap shared plans
- NGINX with FastCGI, or a caching layer like Varnish or LiteSpeed, instead of a stock Apache setup
- Redis or Memcached for object caching, which reduces repeated database queries on dynamic pages
If you’re on shared hosting and TTFB won’t drop below 400 to 500ms no matter what you disable, that’s your signal to move. A dedicated or VPS environment, or a managed WordPress host built around server-side caching, often gets TTFB under 200 milliseconds without touching a single plugin setting.
Pro Tip: Run a TTFB test with every plugin disabled except the bare theme. If TTFB is still slow, the problem is your host, not your site.
Front-End Fixes: Images, Code, and Fonts
Images typically account for 50 to 70% of total page weight, which makes them the single richest target on most sites. Start there before touching a line of CSS.
Image checklist:
- Resize source images to the actual display dimensions, not the camera’s native resolution
- Use responsive
srcsetso mobile devices don’t download desktop-sized files - Convert to WebP or AVIF, which typically cut file size 25 to 50% over JPEG at equivalent quality
- Set explicit
widthandheightattributes to prevent layout shift while images load - Lazy-load everything below the fold, but never lazy-load your LCP image
CSS and JavaScript checklist:
- Strip unused CSS rules, especially leftover framework styles from themes you’ve customized
- Inline the critical CSS needed for the first screen; load the rest asynchronously
- Defer or async any script that doesn’t run the initial render
- Split large JavaScript bundles so pages only load what they actually use
- Delay third-party scripts (chat widgets, analytics tags) until the user’s first scroll or click, since these scripts frequently damage INP more than any other single factor
Fonts: subset to only the character sets you actually use, apply font-display: swap so text renders in a fallback font while custom fonts load, and preload your one or two most critical font files in the document head. Self-hosting fonts instead of pulling from a third-party CDN often shaves 100 to 200ms off render time, though it adds a maintenance step you’ll need to keep current.
Pro Tip: Check your image library for anything named “final2_edit.png” at 4000 pixels wide displayed in a 300 pixel box. That single oversight is more common than any plugin misconfiguration.

For a deeper WordPress-specific walkthrough, see Depeche Code’s guide to optimizing WordPress performance.
Caching Layers and CDN Delivery Explained
Caching works in layers, and conflating them is how sites end up serving stale content or, worse, double-caching in ways that actually slow things down. Page, object, browser, and CDN caching each solve a different problem, and a caching plugin alone can’t fix what’s broken at the server level.
- Page cache stores a fully rendered HTML page so PHP never has to run again for that request
- Object cache (Redis or Memcached) stores database query results, which matters most on sites with dynamic, logged-in, or e-commerce content
- Browser cache tells a visitor’s browser to keep static assets locally so repeat visits skip the download entirely
- CDN edge caching serves assets from a server geographically close to the visitor, cutting network latency before the request even reaches your origin server
Server-level caching (Varnish, NGINX, LiteSpeed Cache) generally outperforms plugin-only caching because it intercepts requests before PHP ever loads. If your host offers it, use it and disable the plugin’s overlapping features. A good comparison of caching plugin trade-offs is worth reading before you pick one, since the wrong pairing creates conflicts that are hard to diagnose.
HTTP/3, built on QUIC, reduces connection setup latency compared to HTTP/2, especially valuable on mobile networks with variable packet loss. Most CDN providers now enable it with a single toggle.
A Safe Workflow for Testing Speed Changes
Speed fixes fail for two reasons: something breaks visually, or you can’t tell which change actually helped. Both are avoidable.
- Back up and stage. Never deploy an untested caching or JS change directly to a live site.
- Change one thing at a time. Test, record the metric, then move to the next fix. Bundle five changes together and a regression becomes a guessing game.
- Test under identical conditions. Same page, same device emulation, same cache state, before and after every change.
- Set up ongoing monitoring. Real User Monitoring or a CrUX-based dashboard catches regressions that lab tests, run once a quarter, will miss entirely.
- Keep a rollback plan. Know exactly how to revert before you deploy, not after something breaks.
Pro Tip: Log every change with a timestamp in a shared doc. Three months from now, when a Core Web Vitals score dips, you’ll want to know exactly what changed and when.
When to Hire an Agency vs. Fix It Yourself
Site owners can reasonably handle image conversion, plugin cleanup, and basic caching setup on their own. Server migrations, database-level tuning, and diagnosing why TTFB won’t drop below 500ms usually call for someone who’s done it repeatedly across different hosting stacks.
Depeche Code works directly in this space:
- WordPress performance audits and configuration fixes
- Hosting migrations to server environments built around NVMe storage and object caching
- Ongoing maintenance plans that catch performance regressions before they cost conversions
- Full redesigns where speed is engineered in from the first line of code, not patched on afterward
Most speed problems that survive a plugin-only fix trace back to a hosting environment that was never built for the site’s traffic or database load in the first place.
If you’ve run through the checklist above and TTFB still won’t move, that’s usually the signal you need a second set of eyes.
Database Optimization Techniques for Dynamic Websites
Every dynamic page, whether it’s a WooCommerce product listing or a membership dashboard, runs database queries before it can render anything. A bloated or poorly indexed database turns every one of those queries into wasted milliseconds that stack up fast.
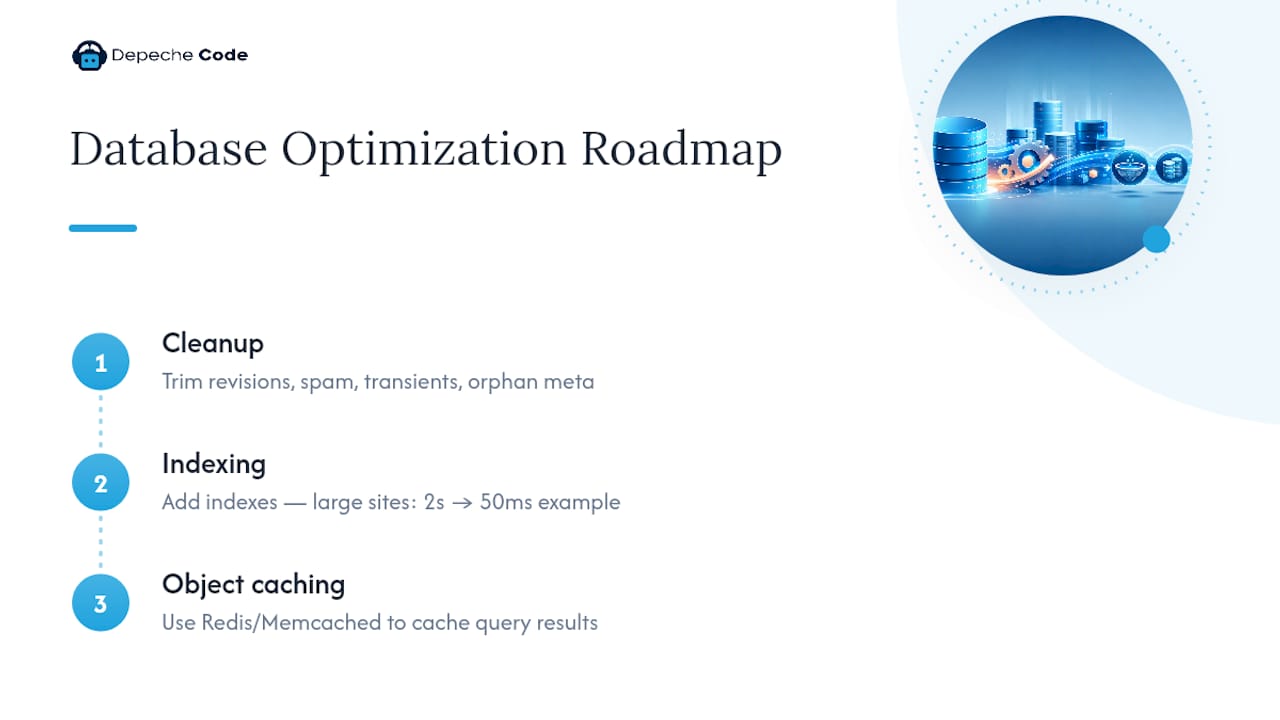
Start with cleanup. Old post revisions, spam comments, expired transients, and orphaned metadata accumulate for years on most sites and slow every query that touches those tables. Trimming that dead weight is often the single fastest database win available, and it requires no code changes.
Indexing matters just as much. Queries that filter or sort by a column without an index force the database to scan every row rather than jumping straight to the match. On a site with a few hundred posts this barely registers; on a site with tens of thousands of products or entries, it’s the difference between a 50ms query and a 2-second one.
Object caching, covered earlier, works hand in hand with database health: Redis or Memcached stores the results of expensive queries so the database doesn’t have to run them again for the next visitor. That combination, clean tables plus object caching, handles the vast majority of database-driven slowdowns on content-heavy or e-commerce sites.
For anything beyond routine cleanup, query optimization and schema changes touch core site functionality and carry real risk if done wrong. That’s squarely the kind of work worth staging carefully or handing to someone who does it regularly.
Reducing Third-Party Scripts’ Impact on Load Time
Chat widgets, analytics tags, ad network scripts, and social embeds are some of the worst offenders for slow, unresponsive pages, and most site owners have no idea how many they’ve accumulated until they audit the page source.
Each third-party script adds a separate network request, and many load additional scripts of their own once they execute. That chain reaction is exactly why a single chat widget can add 500ms or more to a page that would otherwise load quickly. Worse, these scripts frequently run heavy JavaScript on the main thread right when a user tries to click or scroll, which is a direct hit to INP.
The fix isn’t removing every third-party tool. It’s controlling when they load. Delay chat widgets, review popups, and non-critical analytics until the user’s first scroll or interaction rather than loading them the instant the page opens. Most tag managers, including Google Tag Manager, support trigger-based delayed loading for exactly this purpose.
Audit your script list quarterly. Marketing teams add tracking pixels and rarely remove them once a campaign ends, and each one left behind is dead weight on every page load going forward. A script that hasn’t been checked against actual data in six months is a strong candidate for removal.
The Impact of Redirects and How to Minimize Them
Every redirect adds a full round trip: the browser requests the old URL, waits for a response, then requests the new one. On a fast connection that’s maybe 100 to 200 milliseconds. On mobile with higher latency, or when redirects chain three or four deep, that adds up to a full second or more before the actual page even starts loading.
Redirect chains happen quietly over time. A site migrates from HTTP to HTTPS, then changes domains, then restructures its URL slugs, and a visitor following an old backlink ends up bouncing through three redirects before landing on the final page. Search engines and users both pay that latency cost.
Audit your redirect map at least twice a year. Update internal links to point directly at final URLs instead of relying on a redirect to catch them, and consolidate multi-hop chains into a single direct redirect wherever you find one. WordPress redirect plugins make this easy to see, but the fix itself has to happen in your actual link structure, not just the redirect table.
Editorial Take: Why Speed Work Gets Prioritized Backward
Most guides bury hosting on page six after walking through a dozen plugin settings, and that ordering is backward. If your TTFB sits at 700ms, no amount of image compression will get you to a 2.5-second LCP, because the server hasn’t even started sending bytes yet by the time a well-optimized site would already be painting content.
The overrated fix, in my view, is chasing a perfect Lighthouse score. Scores swing based on server load and network conditions at the moment of the test; what matters is whether the Core Web Vitals thresholds hold up in field data across real visits, not whether a single lab run hits 100.
What’s underrated: third-party script audits. Site owners spend hours minifying their own CSS while a chat widget and two ad trackers quietly wreck their INP score, unnoticed because those scripts don’t show up in a casual code review. Fix hosting first, then hunt down what you didn’t write yourself. That’s where the real gains are usually hiding.
Get Your Site’s Speed Fixed by People Who Do This Daily
Reading a checklist is one thing. Migrating hosting environments, tuning object caching, and diagnosing why TTFB won’t budge under load is a different job entirely, and it’s the one Depeche Code handles for businesses that would rather not spend a weekend in a staging environment.

Depeche Code builds and maintains websites with performance engineered in from the start, not patched on after the fact. That means hosting environments sized correctly for your traffic, caching configured at the server level instead of layered plugin fixes fighting each other, and ongoing maintenance that catches a slow query or a bloated script before it costs you conversions. If your current site is fighting its own hosting stack, a full redesign built around performance solves the problem at the root instead of patching around it indefinitely. Get a quote and find out what your current TTFB and Core Web Vitals scores are actually costing you in lost conversions.
Sources
- How performance affects conversion rates — Cloudflare Learning
- WordPress speed optimisation — VeloPress (2026)
FAQ
How do I optimize my website speed?
Start with hosting and TTFB, since that sets the ceiling for every other fix. Then preload your LCP image, convert images to WebP or AVIF, enable page and object caching, and delay third-party scripts until user interaction.
What is the ideal load speed for a website?
Aim for Largest Contentful Paint under 2.5 seconds, INP under 200 milliseconds, and CLS under 0.1, the Core Web Vitals thresholds Google uses as performance benchmarks. TTFB should sit under 200 milliseconds as your baseline.
How do you make a web page load faster?
Fix server-level bottlenecks first, since hosting configuration often sets the achievable floor no matter how much front-end work you do. Then compress images, enable caching at the server level, and defer non-critical JavaScript and third-party scripts.
What is the recommended speed for a website?
Most guidance centers on Core Web Vitals rather than a single load-time number: LCP under 2.5 seconds, INP under 200 milliseconds, CLS under 0.1. A one-second delay in load time can cut conversions by roughly 7%, which is why these thresholds matter beyond just user experience.
Should I hire an agency for website speed optimization or fix it myself?
Basic image compression, plugin cleanup, and caching setup are reasonable for most site owners to handle directly. Server migrations, database tuning, and diagnosing stubborn TTFB issues typically call for agency-level expertise, which is where Depeche Code’s hosting and maintenance services come in.